Graphics operations
Draw graphical primitives into an image stored in an array. The functions
draw_xxx perform a similar operation to the functions plot_xxx
from the Spatial Math Toolbox.
However the draw_xxx render the graphical primitive into the image pixel
array, whereas the plot_xxx use Matplotlib to render the graphical primitive
in a figure window.
- machinevisiontoolbox.base.graphics.draw_box(image, l=None, r=None, t=None, b=None, w=None, h=None, lb=None, lt=None, rb=None, rt=None, wh=None, centre=None, ax=None, bbox=None, ltrb=None, color=None, thickness=1, antialias=False)[source]
Draw a box in an image
- Parameters:
image (ndarray(H,W), ndarray(H,W,P)) – image to draw into, greyscale or color
l (int, optional) – left side coordinate
r (int, optional) – right side coordinate
t (int, optional) – top side coordinate
b (int, optional) – bottom side coordinate
bbox (array_like(4), optional) – bounding box [xmin, xmax, ymin, ymax]
ltrb (array_like(4), optional) – bounding box [xmin, ymin, xmax, ymax]
lb (array_like(2), optional) – left-bottom corner [x,y]
lt (array_like(2), optional) – left-top corner [x,y]
rb (array_like(2), optional) – right-bottom corner (x,y)
rt (array_like(2), optional) – right-top corner (x,y)
wh (array_like(2), optional) – width and height
centre (array_like(2), optional) – box centre (x,y)
color (scalar or array_like) – color of line
thickness (int, optional) – line thickness, -1 to fill, defaults to 1
antialias (bool, optional) – use antialiasing, defaults to False
ax – axes to draw into
- Type:
Matplotlib axes
- Returns:
passed image as modified
- Return type:
ndarray(H,W), ndarray(H,W,P)
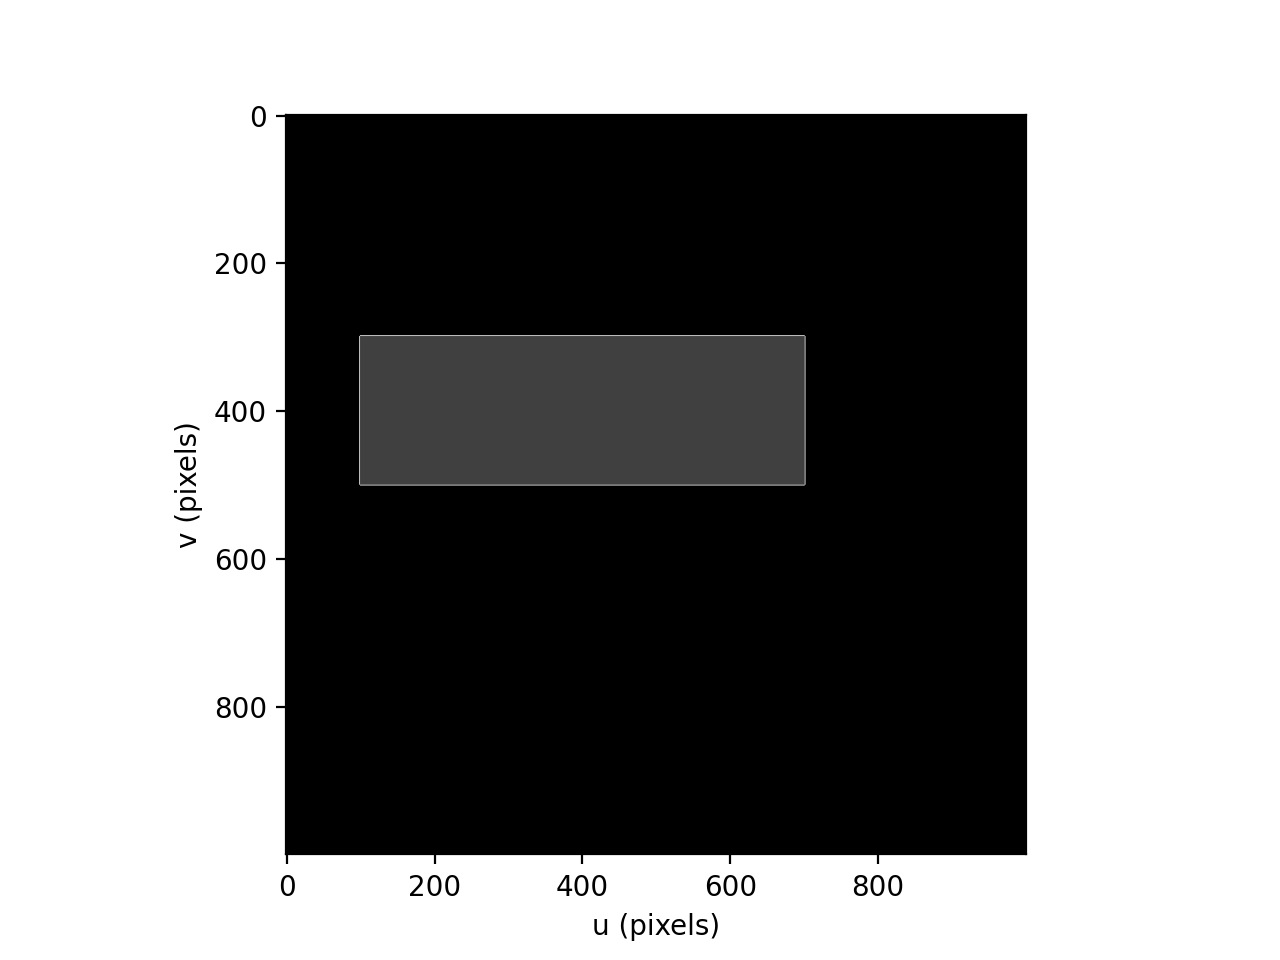
Draws a box into the specified image using OpenCV. The input
imageis modified.The box can be specified in many ways, any combination of inputs is allowed so long as the box is fully specified:
bounding box [xmin, xmax; ymin, ymax]
left-top-right-bottom [xmin, ymin, xmax, ymax]
left side
right side
top side
bottom side
centre and width+height
left-bottom and right-top corners
left-bottom corner and width+height
right-top corner and width+height
left-top corner and width+height
where left-bottom is (xmin, ymin), left-top is (xmax, ymax)
Example:
>>> from machinevisiontoolbox import draw_box, idisp
>>> import numpy as np
>>> img = np.zeros((1000, 1000), dtype='uint8')
>>> draw_box(img, ltrb=[100, 300, 700, 500], thickness=2, color=200)
>>> draw_box(img, ltrb=[100, 300, 700, 500], thickness=-1, color=50)
>>> idisp(img)
(Source code, png, hires.png, pdf)

Note
For images y increases downwards so \(y_{top} < y_{bottom}\)
if
imageis a 3-plane image thencolorshould be a 3-vector or colorname string and the corresponding elements are used in each plane.
- Seealso:
plot_boxopencv.rectangle
- machinevisiontoolbox.base.graphics.plot_labelbox(text, textcolor=None, labelcolor=None, **boxargs)[source]
Plot a labelled box using matplotlib
- Parameters:
text (str) – text label
textcolor (str, array_like(3), optional) – text color, defaults to None
labelcolor (str, array_like(3), optional) – label background color
boxargs – arguments passed to
plot_box
Plot a box with a label above it. The position of the box is specified using the same arguments as for
plot_box. The label font is specified using the same arguments as forplot_text. Iflabelcoloris specified it is used as the background color for the text label, otherwise the box color is used.Example:
>>> from machinevisiontoolbox import plot_labelbox
>>> plot_labelbox('labelled box', bbox=[100, 150, 300, 350], color='r')
Note
The label is drawn at the top of the box assuming that axes are drawn with the y-axis downward (image convention).
- Seealso:
plot_box,plot_text
- machinevisiontoolbox.base.graphics.draw_labelbox(image, text, textcolor=None, labelcolor=None, font='simplex', fontsize=0.9, fontthickness=2, **boxargs)[source]
Draw a labelled box in an image
- Parameters:
text (str) – text label
textcolor (str, array_like(3), optional) – text color, defaults to black
labelcolor (str, array_like(3), optional) – label background color
font (str, optional) – OpenCV font, defaults to cv.FONT_HERSHEY_SIMPLEX
fontsize (float, optional) – OpenCV font scale, defaults to 0.3
fontthickness (int, optional) – font thickness in pixels, defaults to 2
boxargs – arguments passed to
draw_box
- Raises:
TypeError – can’t draw color into a greyscale image
- Returns:
passed image as modified
- Return type:
ndarray(H,W), ndarray(H,W,P)
The position of the box is specified using the same arguments as for
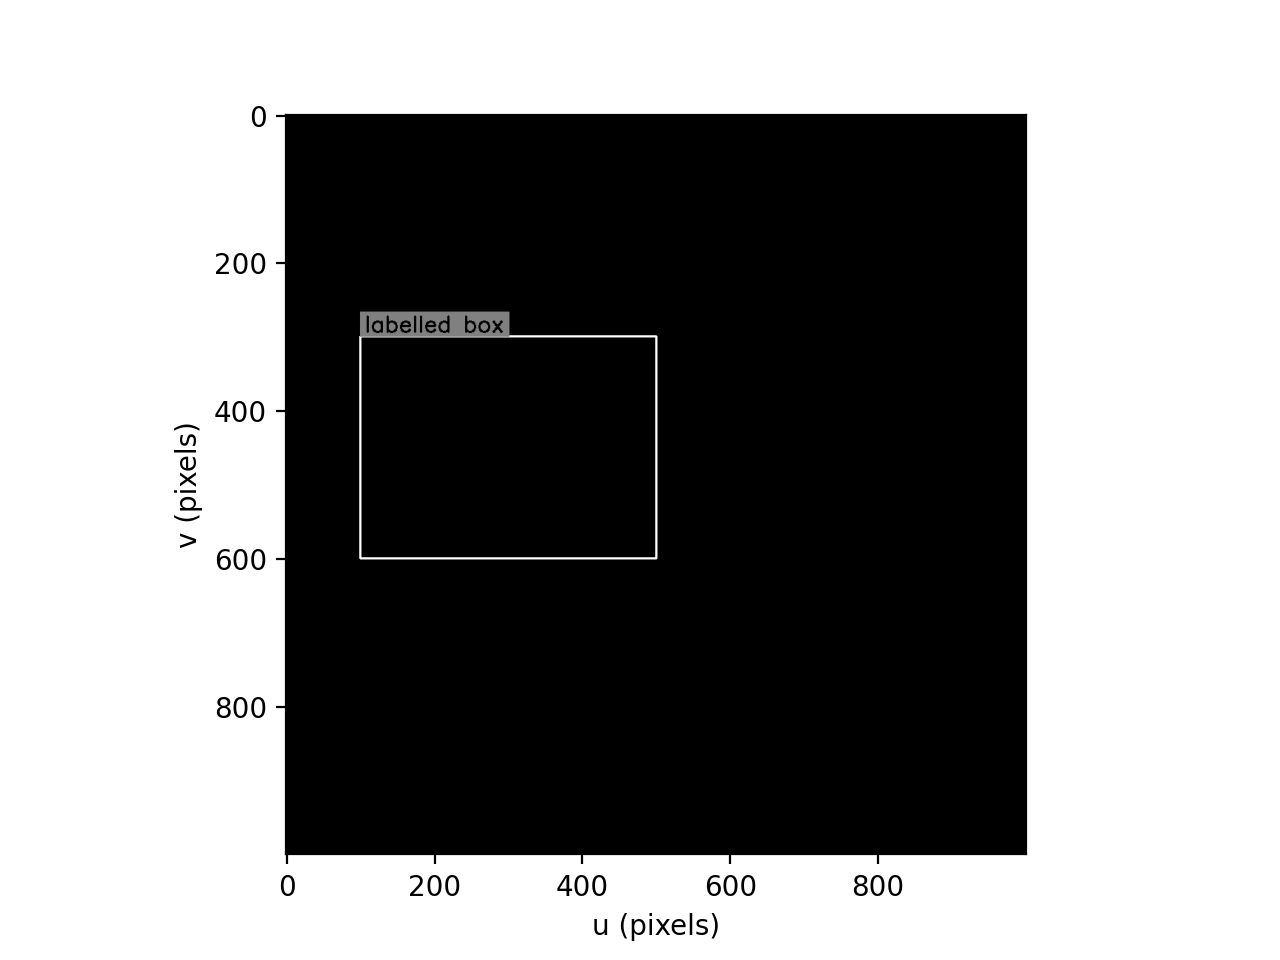
draw_box. The label font is specified using the same arguments as fordraw_text. Iflabelcoloris specified it is used as the background color for the text label, otherwise the box color is used.Example:
>>> from machinevisiontoolbox import draw_labelbox, idisp
>>> import numpy as np
>>> img = np.zeros((500, 500))
>>> draw_labelbox(img, 'labelled box', bbox=[100, 500, 300, 600],
        textcolor=0, labelcolor=100, color=200, thickness=2, fontsize=1)
>>> idisp(img)
(Source code, png, hires.png, pdf)

Note
if
imageis a 3-plane image thencolorshould be a 3-vector or colorname string and the corresponding elements are used in each plane.
- machinevisiontoolbox.base.graphics.draw_text(image, pos, text=None, color=None, font='simplex', fontsize=0.3, fontthickness=2, antialias=False)[source]
Draw text in image
- Parameters:
image (ndarray(H,W), ndarray(H,W,P)) – image to draw into, greyscale or color
pos (array_like(2)) – position of text (u,v)
text (str) – text
color (scalar, array_like(3), str) – color of text
font (str, optional) – font name, defaults to “simplex”
fontsize (float, optional) – OpenCV font scale, defaults to 0.3
fontthickness (int, optional) – font thickness in pixels, defaults to 2
antialias (bool, optional) – use antialiasing, defaults to False
- Returns:
passed image as modified
- Return type:
ndarray(H,W), ndarray(H,W,P)
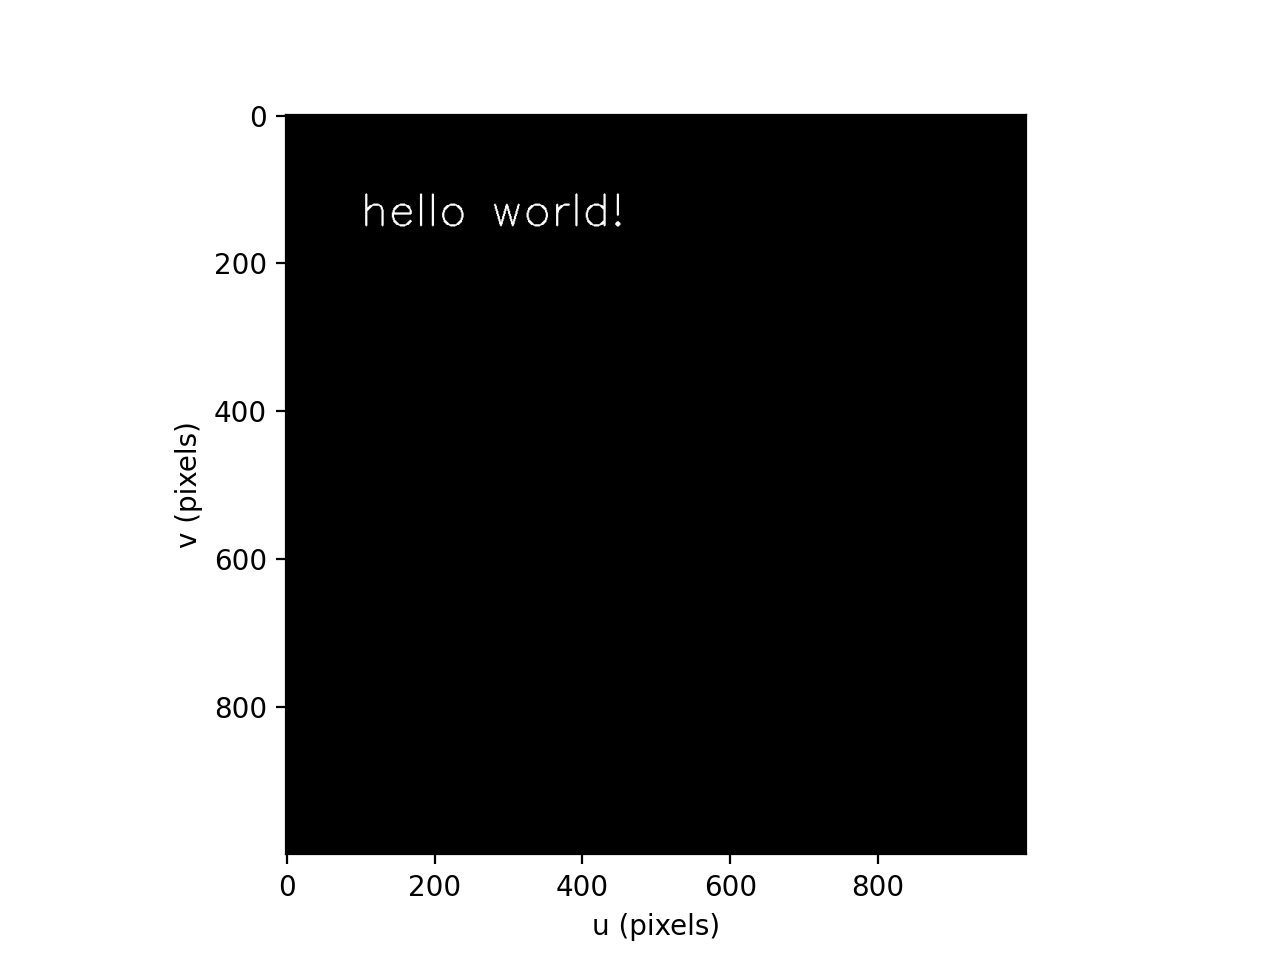
The position corresponds to the bottom-left corner of the text box as seen in the image. The font is specified by a string which selects a Hershey vector (stroke) font.
Font name
OpenCV font name
'simplex'Hershey Roman simplex
'plain'Hershey Roman plain
'duplex'Hershey Roman duplex (double stroke)
'complex'Hershey Roman complex
'triplex'Hershey Romantriplex
'complex-small'Hershey Roman complex (small)
'script-simplex'Hershey script
'script-complex'Hershey script complex
'italic'Hershey italic
Example:
>>> from machinevisiontoolbox import draw_text, idisp
>>> import numpy as np
>>> img = np.zeros((1000, 1000), dtype='uint8')
>>> draw_text(img, (100, 150), 'hello world!', color=200, fontsize=2)
array([[0, 0, 0, ..., 0, 0, 0],
       [0, 0, 0, ..., 0, 0, 0],
       [0, 0, 0, ..., 0, 0, 0],
       ...,
       [0, 0, 0, ..., 0, 0, 0],
       [0, 0, 0, ..., 0, 0, 0],
       [0, 0, 0, ..., 0, 0, 0]], dtype=uint8)
>>> idisp(img)
<matplotlib.image.AxesImage object at 0x7f4bf8d699a0>
(Source code, png, hires.png, pdf)
Note
if
imageis a 3-plane image thencolorshould be a 3-vector or colorname string and the corresponding elements are used in each plane.
- Seealso:
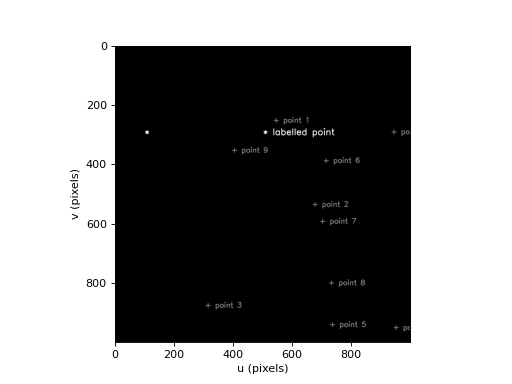
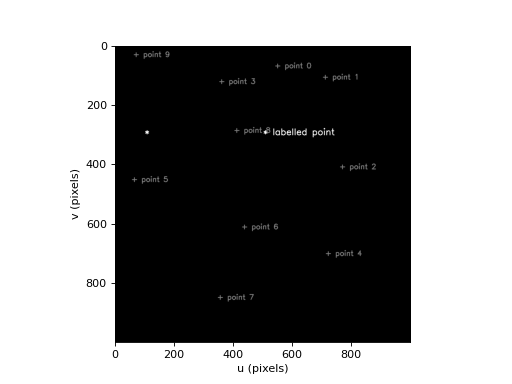
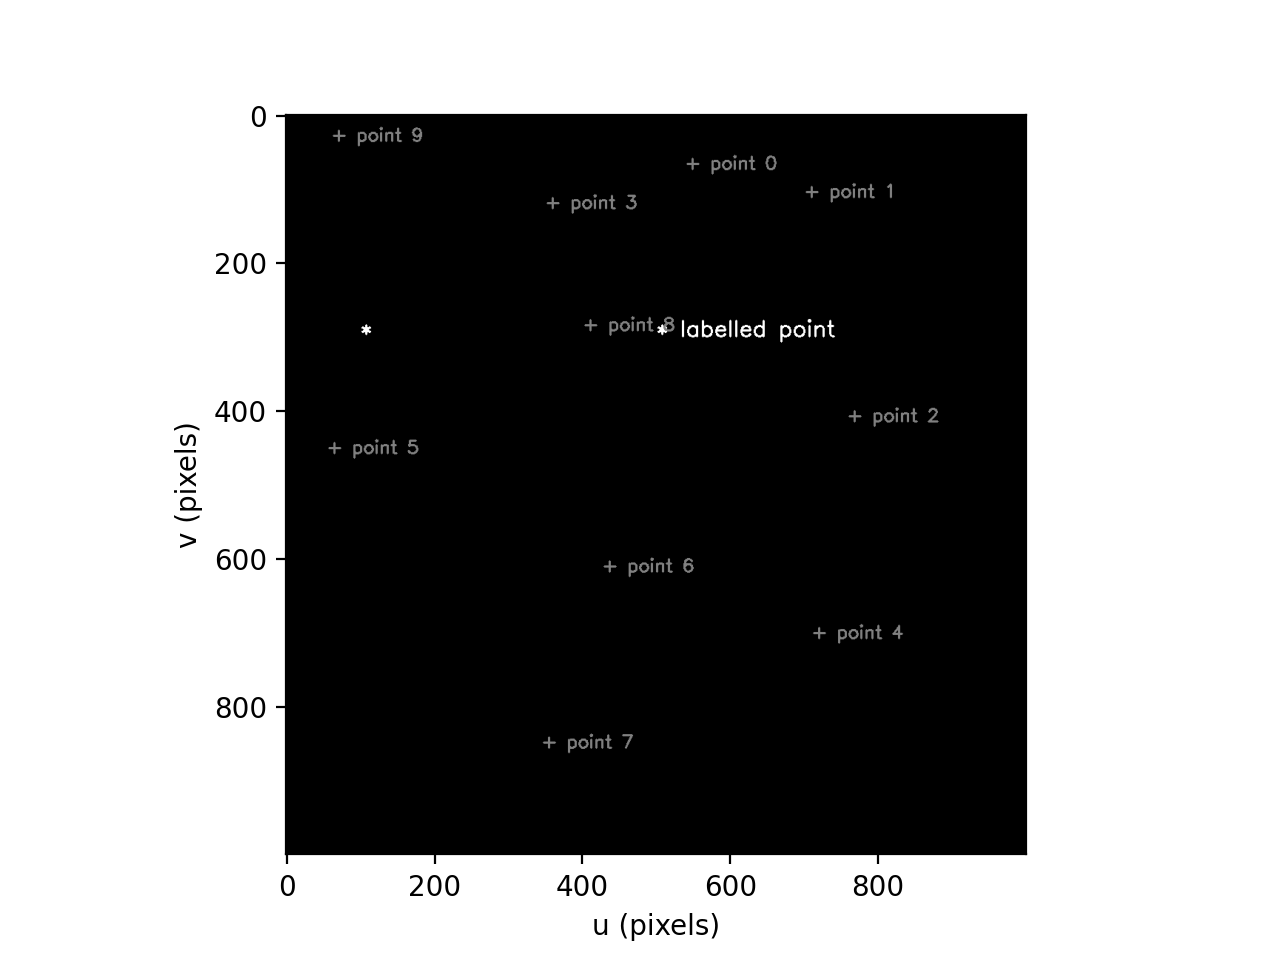
- machinevisiontoolbox.base.graphics.draw_point(image, pos, marker='+', text=None, color=None, font='simplex', fontsize=0.3, fontthickness=2)[source]
Draw a marker in image
- Parameters:
image (ndarray(H,W), ndarray(H,W,P)) – image to draw into, greyscale or color
pos (array_like(2), ndarray(2,n), list of 2-tuples) – position of marker
marker (str, optional) – marker character, defaults to ‘+’
text (str, optional) – text label, defaults to None
color (str or array_like(3), optional) – text color, defaults to None
font (str, optional) – OpenCV font, defaults to cv.FONT_HERSHEY_SIMPLEX
fontsize (float, optional) – OpenCV font scale, defaults to 0.3
fontthickness (int, optional) – font thickness in pixels, defaults to 2
- Raises:
TypeError – can’t draw color into a greyscale image
- Returns:
passed image as modified
- Return type:
ndarray(H,W), ndarray(H,W,P)
The
textlabel is placed to the right of the marker, and vertically centred. The color of the marker can be different to the color of the text, the marker color is specified by a single letter in the marker string, eg. ‘b+’.Multiple points can be marked if
posis a \(2 \times n\) array or a list of coordinate pairs. In this case:if
textis a string it is processed withtext.format(i)whereiis the point index (starting at zero). “{0}” within text will be substituted by the point index.if
textis a list, its elements are used to label the points
The font is specified by a string which selects a Hershey vector (stroke) font.
Font name
OpenCV font name
'simplex'Hershey Roman simplex
'plain'Hershey Roman plain
'duplex'Hershey Roman duplex (double stroke)
'complex'Hershey Roman complex
'triplex'Hershey Romantriplex
'complex-small'Hershey Roman complex (small)
'script-simplex'Hershey script
'script-complex'Hershey script complex
'italic'Hershey italic
Example:
>>> from machinevisiontoolbox import draw_point, idisp
>>> import numpy as np
>>> img = np.zeros((1000, 1000), dtype='uint8')
>>> draw_point(img, (100, 300), '*', fontsize=1, color=200)
>>> draw_point(img, (500, 300), '*', 'labelled point', fontsize=1, color=200)
>>> draw_point(img, np.random.randint(1000, size=(2,10)), '+', 'point {0}', 100, fontsize=0.8)
>>> idisp(img)
(Source code, png, hires.png, pdf)
Note
if
imageis a 3-plane image thencolorshould be a 3-vector or colorname string and the corresponding elements are used in each plane.
- Seealso:
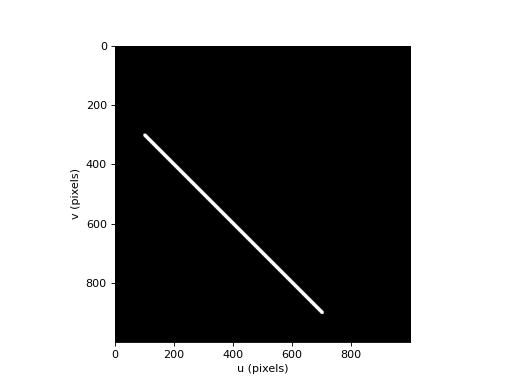
- machinevisiontoolbox.base.graphics.draw_line(image, start, end, color, thickness=1, antialias=False)[source]
Draw line in image
- Parameters:
image (ndarray(H,W), ndarray(H,W,P)) – image to draw into, greyscale or color
start (array_like(2) int) – start coordinate (u,v)
end (array_like(2) int) – end coordinate (u,v)
color (scalar, array_like(3)) – color of line
thickness (int, optional) – width of line in pixels, defaults to 1
antialias (bool, optional) – use antialiasing, defaults to False
- Raises:
TypeError – can’t draw color into a greyscale image
- Returns:
passed image as modified
- Return type:
ndarray(H,W), ndarray(H,W,P)
Example:
>>> from machinevisiontoolbox import draw_line, idisp
>>> import numpy as np
>>> img = np.zeros((1000, 1000), dtype='uint8')
>>> draw_line(img, (100, 300), (700, 900), color=200, thickness=10)
array([[0, 0, 0, ..., 0, 0, 0],
       [0, 0, 0, ..., 0, 0, 0],
       [0, 0, 0, ..., 0, 0, 0],
       ...,
       [0, 0, 0, ..., 0, 0, 0],
       [0, 0, 0, ..., 0, 0, 0],
       [0, 0, 0, ..., 0, 0, 0]], dtype=uint8)
>>> idisp(img)
<matplotlib.image.AxesImage object at 0x7f702fda9970>
(Source code, png, hires.png, pdf)
Note
if
imageis a 3-plane image thencolorshould be a 3-vector or colorname string and the corresponding elements are used in each plane.
- Seealso:
plot_lineopencv.line
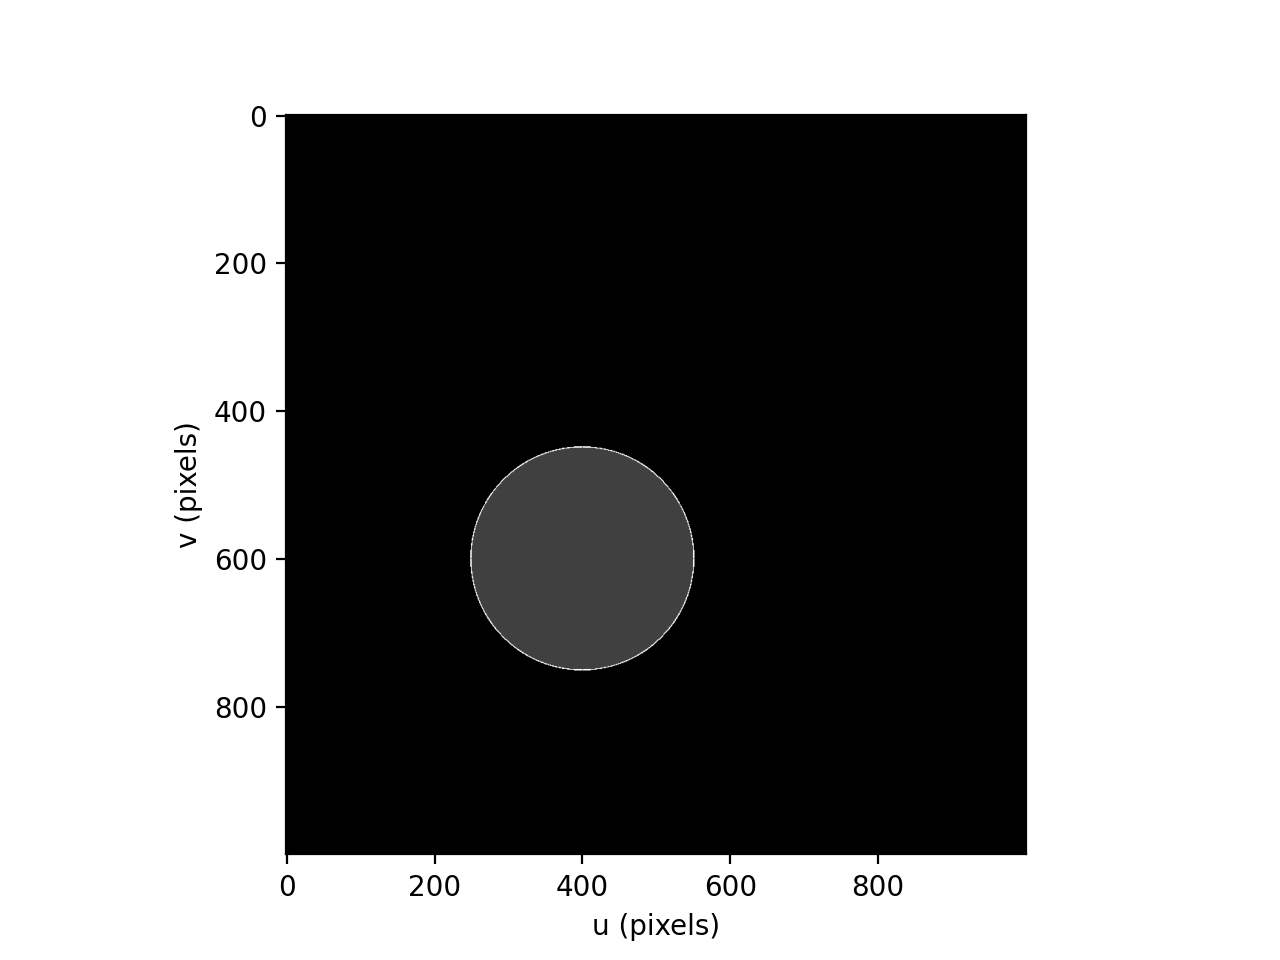
- machinevisiontoolbox.base.graphics.draw_circle(image, centre, radius, color, thickness=1, antialias=False)[source]
Draw line in image
- Parameters:
image (ndarray(H,W), ndarray(H,W,P)) – image to draw into, greyscale or color
centre – centre coordinate
radius – radius in pixels
color (scalar, array_like(3)) – color of circle
thickness (int, optional) – width of line in pixels, -1 to fill, defaults to 1
antialias (bool, optional) – use antialiasing, defaults to False
- Raises:
TypeError – can’t draw color into a greyscale image
- Returns:
passed image as modified
- Return type:
ndarray(H,W), ndarray(H,W,P)
Example:
>>> from machinevisiontoolbox import draw_circle, idisp
>>> import numpy as np
>>> img = np.zeros((1000, 1000), dtype='uint8')
>>> draw_circle(img, (400,600), 150, thickness=2, color=200)
>>> draw_circle(img, (400,600), 150, thickness=-1, color=50)
>>> idisp(img)
(Source code, png, hires.png, pdf)

Note
if
imageis a 3-plane image thencolorshould be a 3-vector or colorname string and the corresponding elements are used in each plane.
- Seealso: