Image input/output
These methods read, write and display images.
- class machinevisiontoolbox.ImageIO.ImageIOMixin[source]
- classmethod Read(filename, alpha=False, rgb=True, **kwargs)[source]
Read image from file
- Parameters:
filename (str) – image file name
alpha (bool, optional) – include alpha plane if present, defaults to False
rgb (bool, optional) – force color image to be in RGB order, defaults to True
kwargs – options applied to image frames, see
convert
- Raises:
ValueError – file not found
- Returns:
image from file
- Return type:
Image
Load monochrome or color image from file, many common formats are supported. A number of transformations can be applied to the image loaded from the file before it is returned.
Example:
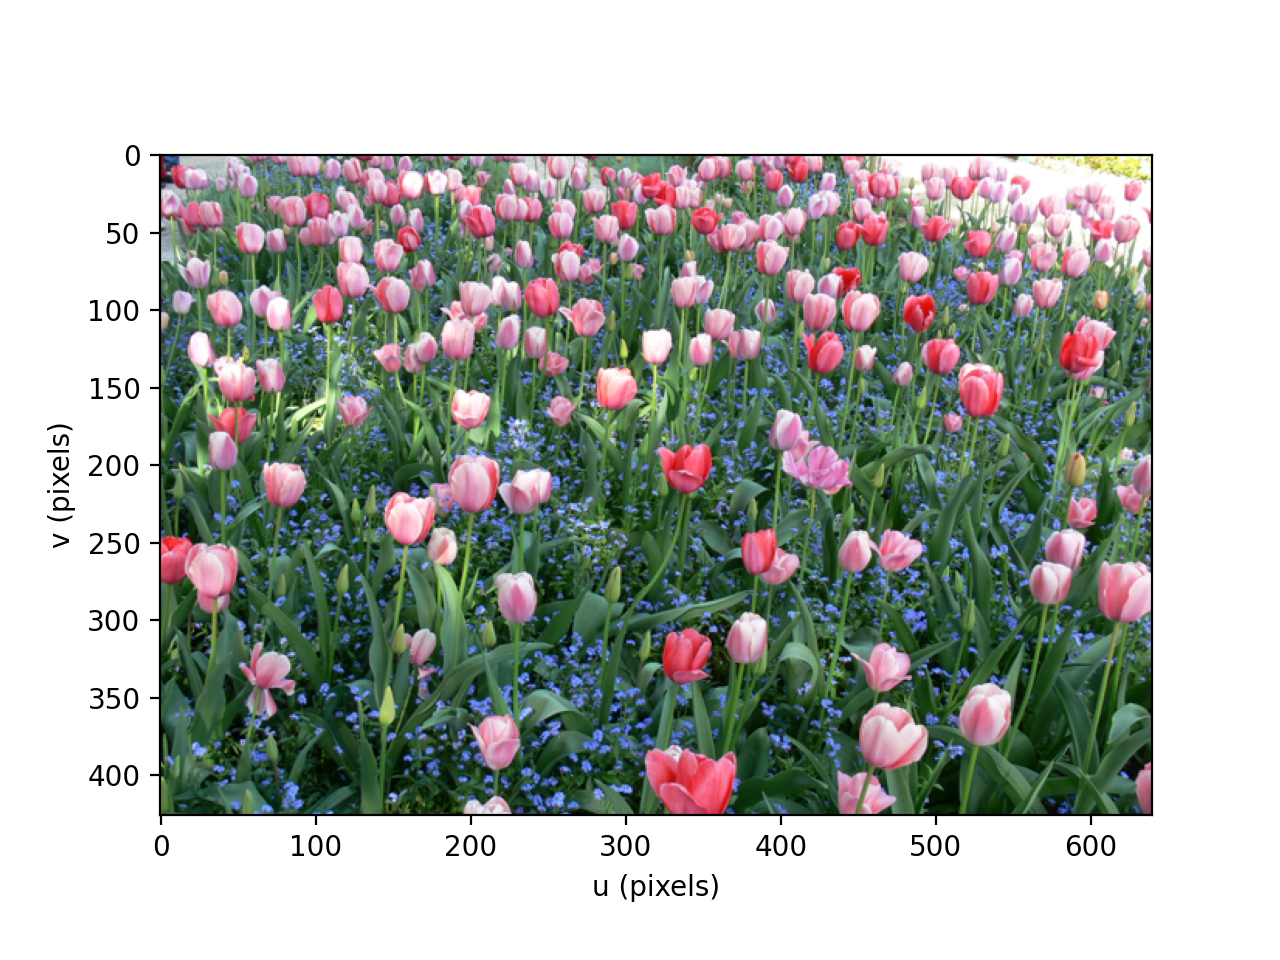
>>> from machinevisiontoolbox import Image
>>> Image.Read('street.png')
Image: 1280 x 851 (uint8) [.../images/street.png]
>>> Image.Read('flowers1.png')
Image: 640 x 426 (uint8), R:G:B [.../images/flowers1.png]
>>> Image.Read('flowers1.png', grey=True)
Image: 640 x 426 (uint8) [.../images/flowers1.png]
>>> Image.Read('flowers1.png', dtype='float16')
Image: 640 x 426 (float16), R:G:B [.../images/flowers1.png]
>>> Image.Read('flowers1.png', reduce=4)
Image: 160 x 107 (uint8), R:G:B [.../images/flowers1.png]
>>> Image.Read('flowers1.png', gamma='sRGB') # linear tristimulus values
Image: 640 x 426 (uint8), R:G:B [.../images/flowers1.png]
- Note:
If the path is not absolute it is first searched for relative to the current directory, and if not found, it is searched for in the
imagesfolder of the`mvtb_datapackage <https://github.com/petercorke/machinevision-toolbox-python/tree/master/mvtb-data>`_.- Seealso:
- disp(title=None, **kwargs)[source]
Display image
- Parameters:
title (bool) – named of window, defaults to image
namekwargs – options, see
idisp
Display an image using either Matplotlib (default) or OpenCV.
Example:
>>> from machinevisiontoolbox import Image
>>> img = Image.Read('flowers1.png')
>>> img.disp()
<matplotlib.image.AxesImage object at 0x7fc7a55d7040>
(Source code, png, hires.png, pdf)

- Seealso:
- write(filename, dtype='uint8', **kwargs)[source]
Write image to file
- Parameters:
filename (str) – filename to write to
dtype (str) – data type to convert to, before writing
kwargs – options for
iwrite
Write image data to a file. The file format is taken from the extension of the filename.
Example:
>>> from machinevisiontoolbox import Image
>>> img = Image.Read('flowers1.png')
>>> img.write('flowers.jpg')
True
- Seealso:
iwritecv2.imwrite
- metadata(key=None)[source]
Get image EXIF metadata
- Parameters:
key (str, optional) – metadata key
- Returns:
image metadata
- Return type:
dict, int, float, str
Get image metadata from EXIF headers.
Example:
>>> from machinevisiontoolbox import Image
>>> img = Image.Read('church.jpg')
>>> meta = img.metadata()  # get all metadata as a dict
>>> len(meta)
38
>>> meta
{'ResolutionUnit': 2, 'ExifOffset': 188, 'Make': 'Panasonic', 'Model': 'DMC-FZ30', 'Software': 'Ver.1.0  ', 'Orientation': 1, 'DateTime': '2009:08:22 15:50:06', 'XResolution': 72.0, 'YResolution': 72.0, 'ExifVersion': b'0220', 'FlashPixVersion': b'0100', 'CompressedBitsPerPixel': 4.0, 'DateTimeOriginal': '2009:08:22 15:50:06', 'DateTimeDigitized': '2009:08:22 15:50:06', 'ExposureBiasValue': 0.0, 'MaxApertureValue': 3.0, 'MeteringMode': 5, 'LightSource': 0, 'Flash': 16, 'FocalLength': 7.4, 'ColorSpace': 1, 'ExifImageWidth': 1280, 'DigitalZoomRatio': 0.0, 'FocalLengthIn35mmFilm': 37, 'SceneCaptureType': 0, 'ExifImageHeight': 851, 'Contrast': 0, 'Saturation': 0, 'Sharpness': 0, 'SensingMethod': 2, 'ExposureTime': 0.0025, 'FNumber': 8.0, 'ExposureProgram': 2, 'CustomRendered': 0, 'ISOSpeedRatings': 80, 'ExposureMode': 0, 'WhiteBalance': 0, 'GainControl': 0}
>>> meta['FocalLength']
7.4
>>> img.metadata('FocalLength')  # get specific metadata item
7.4
- Note:
Metadata items will be converted, where possible, to int or float values.
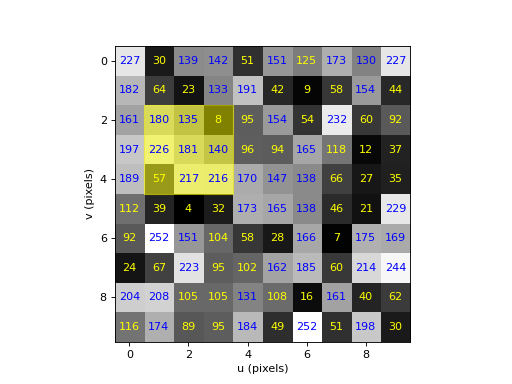
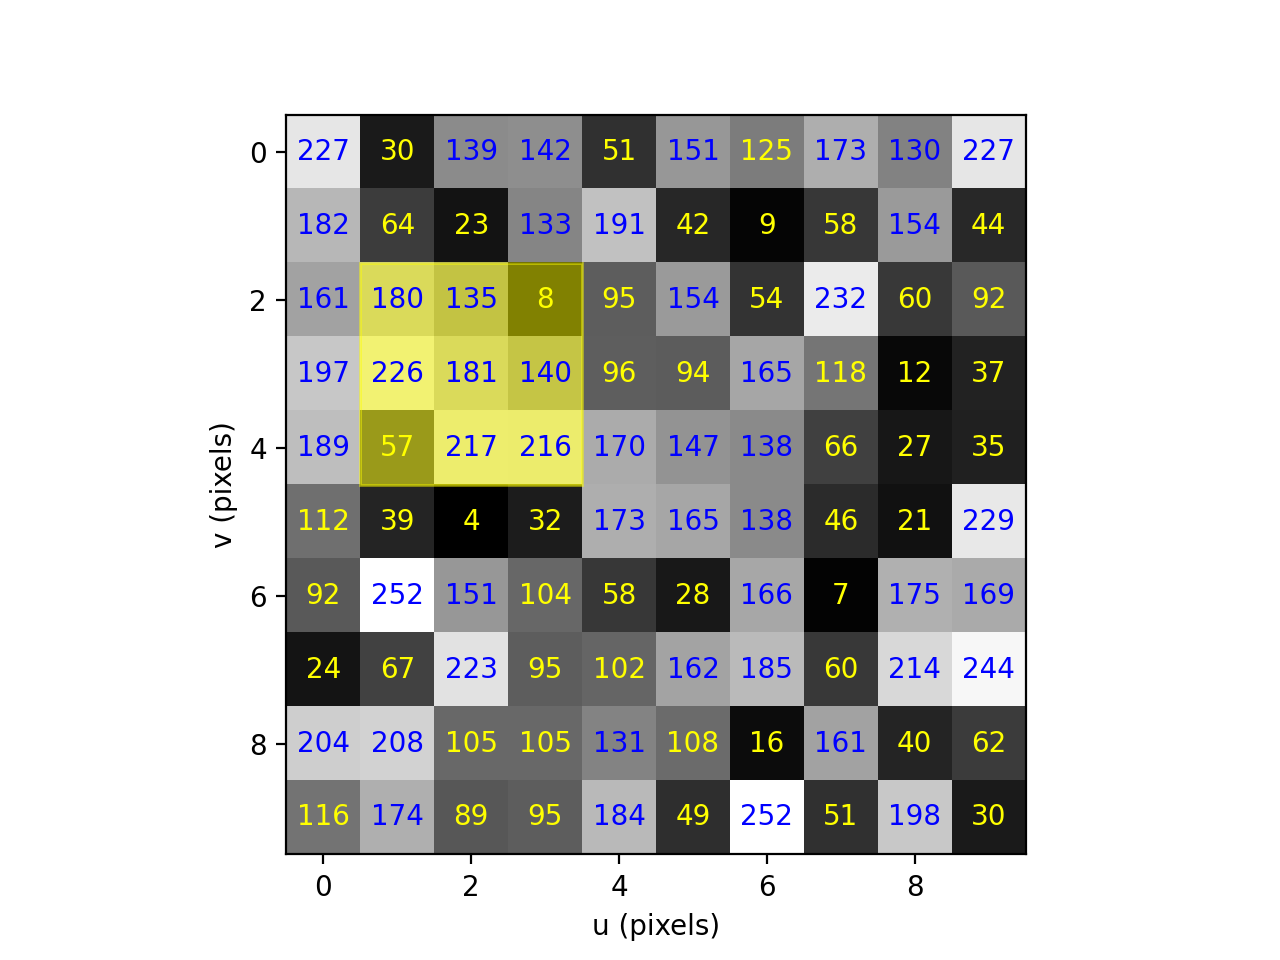
- showpixels(textcolors=['yellow', 'blue'], fmt=None, ax=None, windowsize=0, **kwargs)[source]
Display image with pixel values
- Parameters:
textcolors (list or str, optional) – text color, defaults to [‘yellow’, ‘blue’]
fmt (str, optional) – format string for displaying pixel values, defaults to None
ax (axes, optional) – Matplotlb axes to draw into, defaults to None
windowsize (int, optional) – half side length of superimposed moving window, defaults to 0
- Returns:
a moving window
- Return type:
Windowinstance
Display a monochrome image with the pixel values overlaid. This is suitable for small images, of order 10x10, used for pedagogical purposes. For example it can be used to animate the operation of sliding window operations like convolution or morphology.
textcolorscan be:a colorname string, in which case all pixel values are displayed in that color
“grey”, in which case the pixel values are displayed in grey that is signficantly different from the pixel value
a 2-element tuple or list. The first color in
textcolorsis used for pixels below 50% intensity and the second color for those above 50%.
If
windowsizeis given then a translucent colored window is superimposed and aWindowinstance returned. This allows the window position, color and opacity to be changed.Example:
>>> from machinevisiontoolbox import Image
>>> img = Image.Random(10)
>>> window = img.showpixels(windowsize=1) # with 3x3 window
>>> window.move(2,3) # position window at (2,3)
Image: 3 x 3 (uint8)
>>> window.move(4,5, color='blue', alpha=0.7)
Image: 3 x 3 (uint8)
(Source code, png, hires.png, pdf)
(Source code, png, hires.png, pdf)
- Seealso:
print
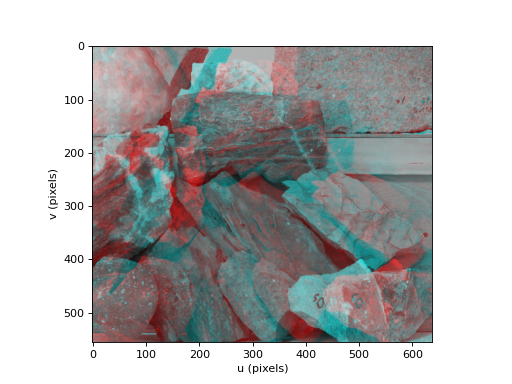
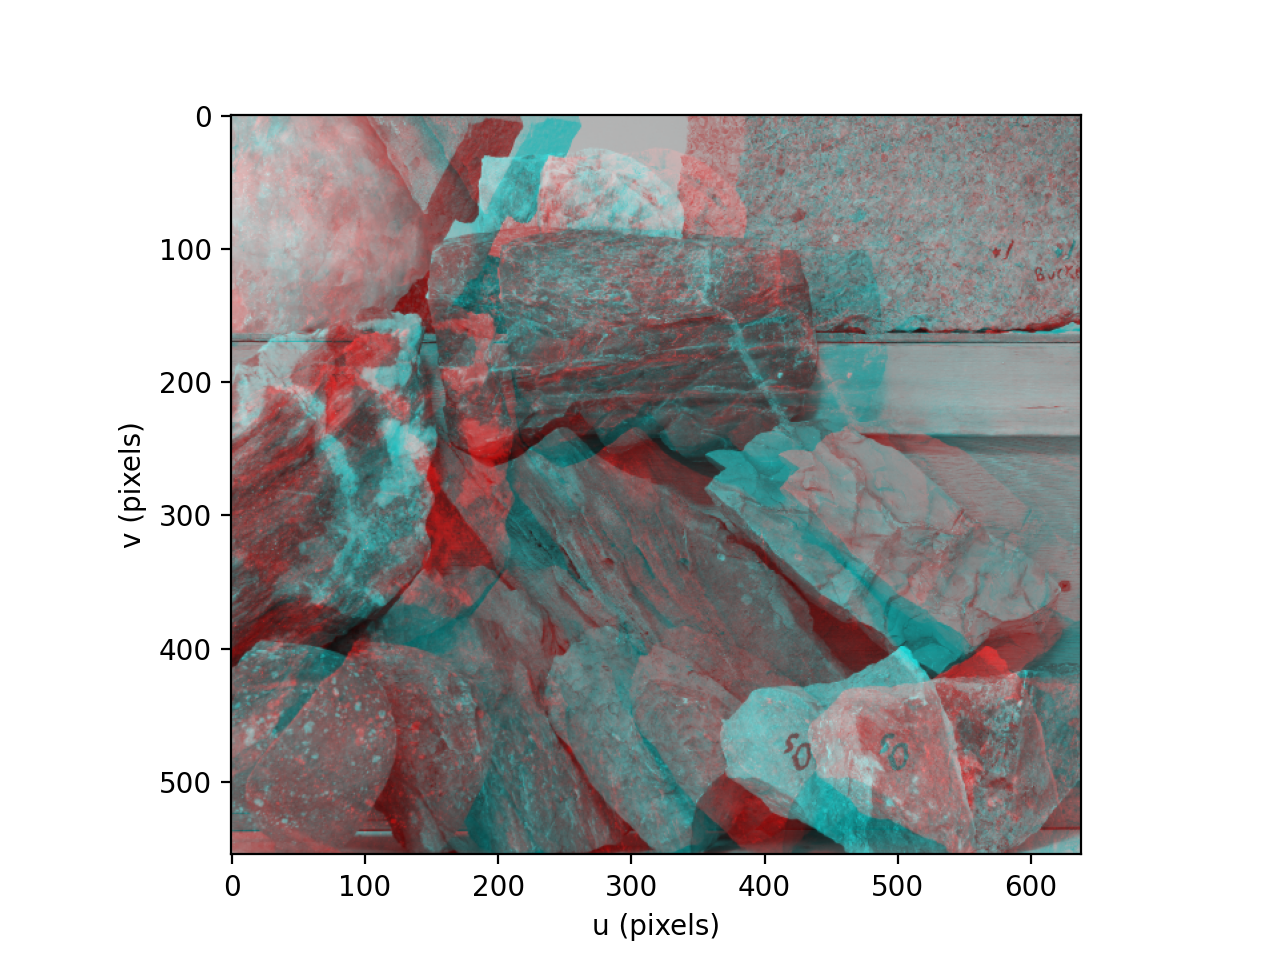
- anaglyph(right, colors='rc', disp=0)[source]
Convert stereo images to an anaglyph image
- Parameters:
right (Image instance) – right image
colors (str, optional) – lens colors (left, right), defaults to ‘rc’
disp (int, optional) – disparity, defaults to 0
- Raises:
ValueErrror – images are not the same size
- Returns:
anaglyph image
- Return type:
Image
Returns an anaglyph image which combines the two images of a stereo pair by coding them in two different colors. By default the left image is red, and the right image is cyan.
colorsdescribes the lens color coding as a string with 2 letters, the first for left, the second for right, and each is one of:code
color
‘r’
red
‘g’
green
‘b’
green
‘c’
cyan
‘m’
magenta
If
dispis positive the disparity is increased by shifting therightimage to the right. If negative disparity is reduced by shifting therightimage to the left. These adjustments are achieved by trimming the images. Use this option to make the images more natural/comfortable to view, useful if the images were captured with a stereo baseline significantly different to the human eye separation (typically 65mm).Example:
>>> from machinevisiontoolbox import Image
>>> left = Image.Read("rocks2-l.png", reduce=2)
>>> right = Image.Read("rocks2-r.png", reduce=2)
>>> left.anaglyph(right).disp()
<matplotlib.image.AxesImage object at 0x7f354eb9a0d0>
(Source code, png, hires.png, pdf)
- Reference:
Robotics, Vision & Control for Python, Section 14.4, P. Corke, Springer 2023.
- Seealso:
stdispOverlay
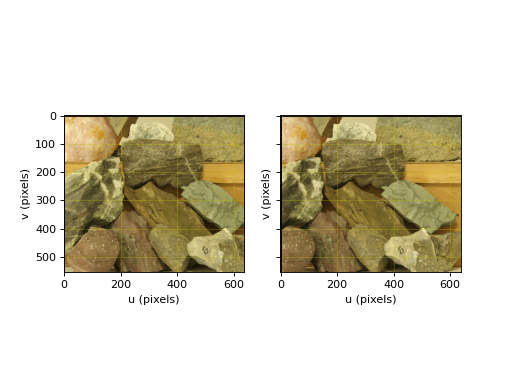
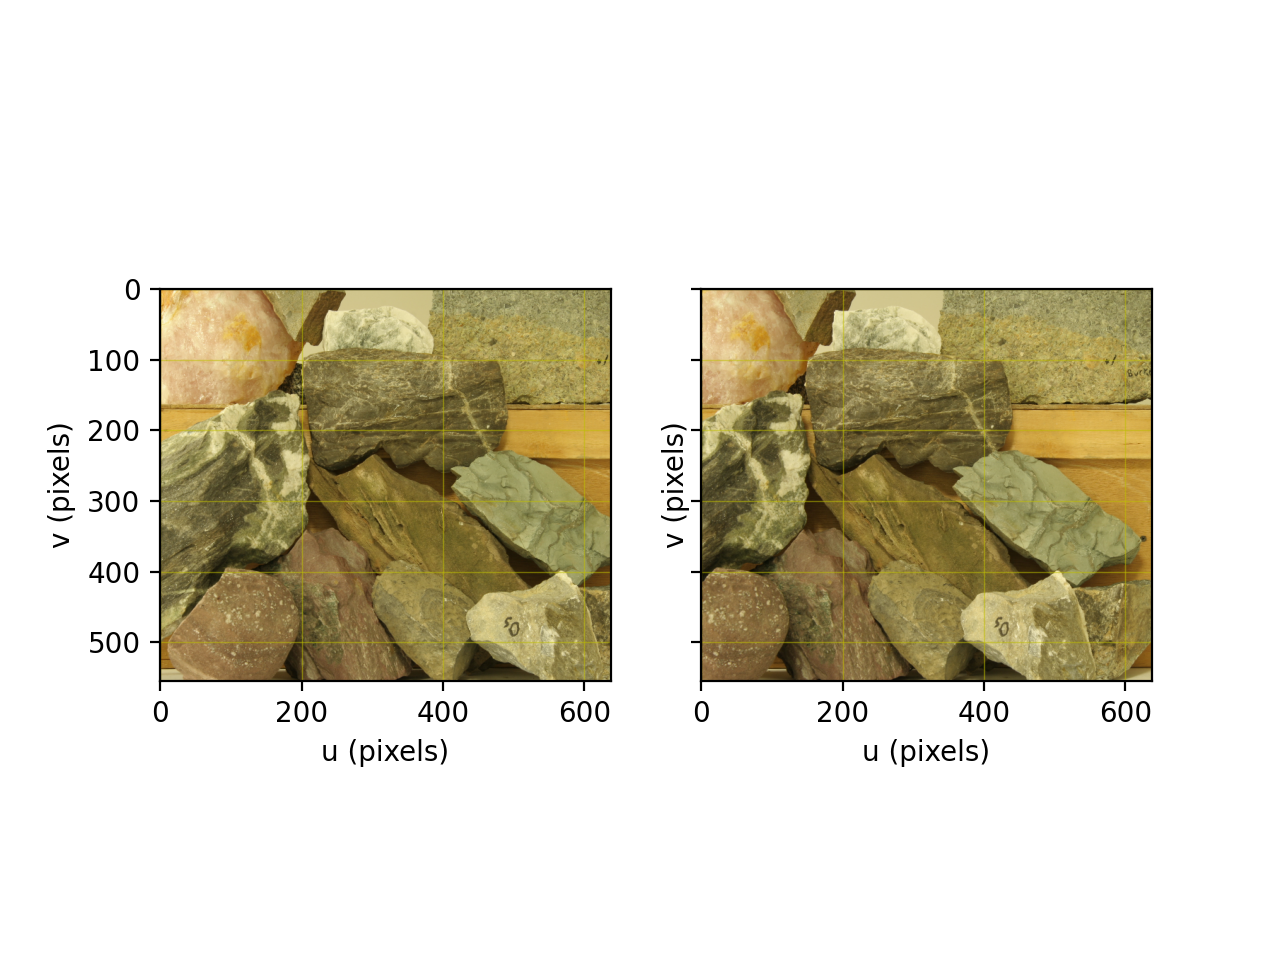
- stdisp(right)[source]
Interactive display of stereo image pair
- Parameters:
right (
Image) – right image
The left and right images are displayed, stacked horizontally. Clicking in the left-hand image sets a crosshair cursor in the right-hand image. Clicking the corresponding point in the right-hand image will display the disparity at the top of the right-hand image.
Example:
>>> from machinevisiontoolbox import Image
>>> left = Image.Read("rocks2-l.png", reduce=2)
>>> right = Image.Read("rocks2-r.png", reduce=2)
>>> left.stdisp(right)
(Source code, png, hires.png, pdf)

- Note:
The images are assumed to be epipolar aligned.
- Reference:
Robotics, Vision & Control for Python, Section 14.4, P. Corke, Springer 2023.
- Seealso: