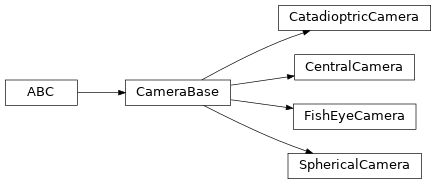
Camera models and calibration
Camera models
A set of classes that model the projective geometry of cameras.

Create central camera projection model |
|
Create fisheye camera projection model |
|
Create catadioptric camera projection model |
|
Create spherical camera projection model |
Calibration
Intrinsic calibration of camera from multiple images
- class machinevisiontoolbox.Camera.CentralCamera(f=1, distortion=None, **kwargs)[source]
Create central camera projection model

- Parameters:
f (float, optional) – focal length, defaults to 8mm
distortion (array_like(5), optional) – camera distortion parameters, defaults to None
kwargs – arguments passed to
CameraBaseconstructor
A camera object contains methods for projecting 3D points and lines to the image plane, as well as supporting a virtual image plane onto which 3D points and lines can be drawn.
- References:
Robotics, Vision & Control for Python, Section 13.1, P. Corke, Springer 2023.
- Seealso:
CameraBaseFishEyeCameraSphericalCamera
- classmethod images2C(images, gridshape=(7, 6), squaresize=0.025)[source]
Calibrate camera from checkerboard images
- Parameters:
images (
ImageSource) – an iterator that returnsImageobjectsgridshape (tuple, optional) – number of grid squares in each dimension, defaults to (7,6)
squaresize (float, optional) – size of the grid squares in units of length, defaults to 0.025
- Returns:
camera calibration matrix, distortion parameters, image frames
- Return type:
ndarray(3,4), ndarray(5), list of named tuples
The distortion coefficients are in the order \((k_1, k_2, p_1, p_2, k_3)\) where \(k_i\) are radial distortion coefficients and \(p_i\) are tangential distortion coefficients.
Image frames that were successfully processed are returned as a list of named tuples
CalibrationFramewith elements:element
type
description
image
Imagecalibration image with overlaid annotation
pose
SE3instancepose of the camera with respect to the origin of this image
id
int
sequence number of this image in
images- Note:
The units used for
squaresizemust match the units used for defining 3D points in space.- References:
Robotics, Vision & Control for Python, Section 13.7, P. Corke, Springer 2023.
- Seealso:
Cpoints2CdecomposeCSE3
Extrinsic calibration of camera from marker ArUcoBoard
- class machinevisiontoolbox.ImageRegionFeatures.ArUcoBoard(layout, sidelength, separation, dict, name=None)[source]
- estimatePose(image, camera)[source]
Estimate the pose of the board
- Parameters:
image (Image) – image containing the board
camera (
CentralCamera) – model of the camera, including intrinsics and distortion parameters
- Raises:
ValueError – the boards pose could not be estimated
- Returns:
Camera pose with respect to board origin, vector of residuals in units of pixels in marker ID order, corresponding marker IDs
- Return type:
3-tuple of SE3, numpy.ndarray, numpy.ndarray
Residuals are the Euclidean distance between the detected marker corners and the reprojected corners in the image plane, in units of pixels. The mean and maximum residuals are useful for assessing the quality of the pose estimate.
- draw(image, camera, length=0.1, thick=2)[source]
Draw board coordinate frame into image
- Parameters:
image (
Image) – image with BGR color orderlength (float, optional) – axis length in metric units, defaults to 0.1
thick (int, optional) – axis thickness in pixels, defaults to 2
- Raises:
ValueError – image must have BGR color order
Draws a coordinate frame into the image representing the pose of the board. The x-, y- and z-axes are drawn as red, green and blue line segments.
- Note:
the
lengthis specified in the same units as focal length and pixel size of the camera, and the marker dimensions, typically meters.
- chart(filename, dpi=100)[source]
Write ArUco chart to a file
- Parameters:
filename (str) – name of the file to write
dpi (int, optional) – dots per inch of printer, defaults to 100
PIL is used to write the file, and can support multiple formats (specified by the file extension) such as PNG, PDF, etc.
If a PDF file is written the chart can be printed at 100% scale factor and will have the correct dimensions. The size is of the chart is invariant to the
dpiparameter, simply affects the resolution of the image and file size.- Note:
This method assumes that the dimensions given in the constructor are in meters.