
Image.hist#
- Image.hist(nbins: int = 256, sorted: bool | str = False, span: Literal['dtype'] | tuple[float, float] | None = 'dtype', clip: bool = False, opt: str | None = None) Histogram[source]#
Image histogram
- Parameters:
nbins (int, optional) – number of histogram bins, defaults to 256
sorted (bool) – sort bins by count rather than value, defaults to False
span (str, tuple(float, float), None) – histogram span definition, defaults to
'dtype';'dtype'means full span of image dtype if integer or [0,1] for float,Nonemeans finite data min/max,(a,b)means explicit rangeclip (bool, optional) – clip out-of-span values to span endpoints before binning, defaults to False. If False, out-of-span values are ignored.
opt (str, optional) – deprecated histogram option string, use
sortedinstead; supported legacy value is'sorted'
- Returns:
histogram of image
- Return type:
Returns an object that summarizes the distribution of pixel values in each color plane.
Example:
from machinevisiontoolbox import Image
img = Image.Read('street.png')
type(hist)
hist = img.hist()
hist
hist.plot()
(
Source code,png,hires.png,pdf)
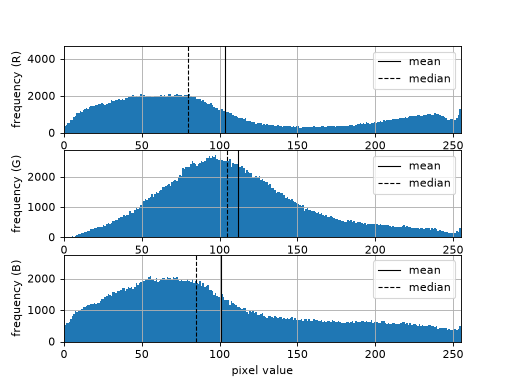
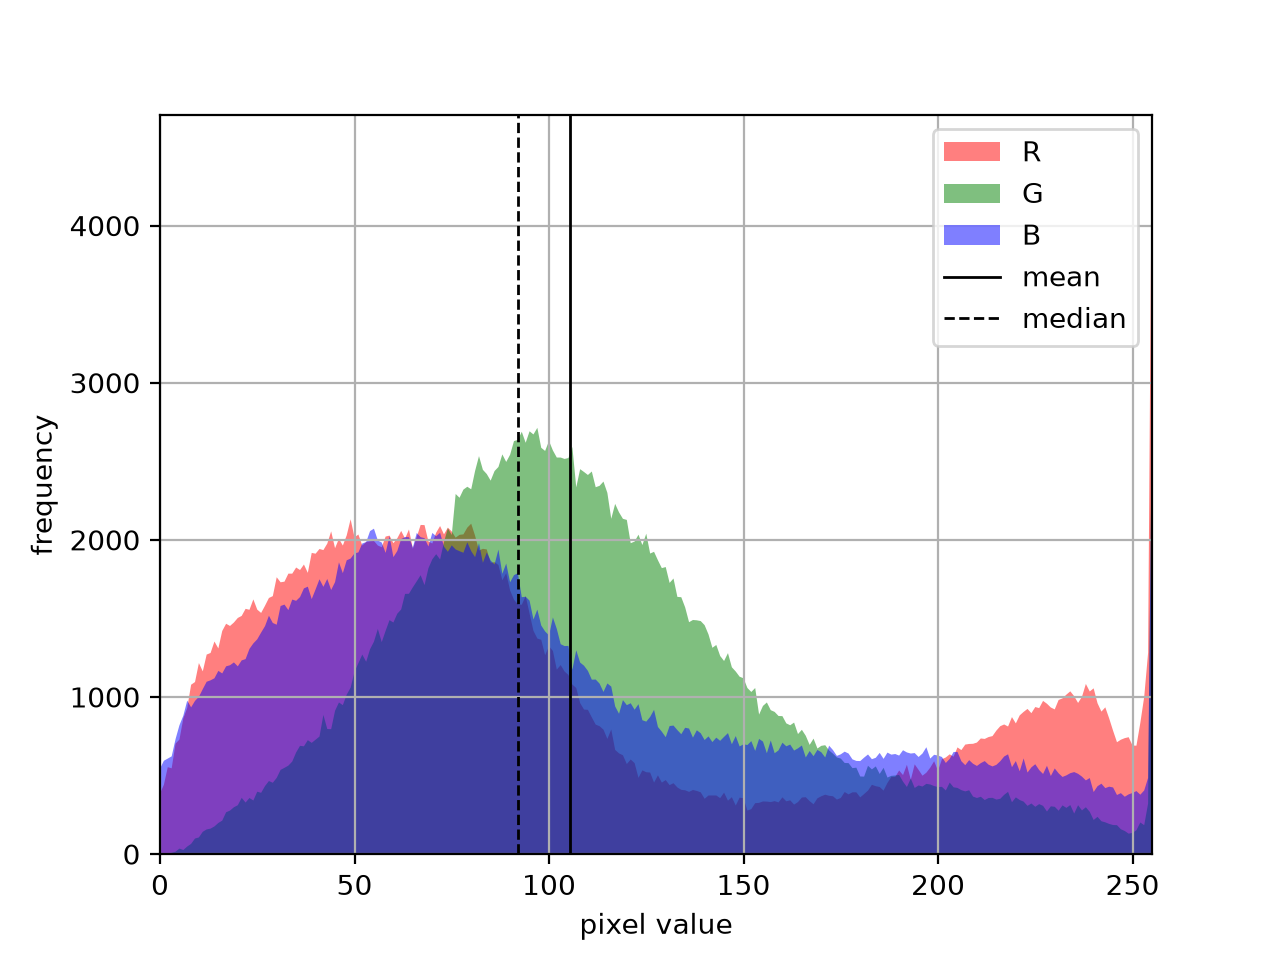
Example:
from machinevisiontoolbox import Image
img = Image.Read('flowers1.png')
hist = img.hist()
hist
hist.plot(style='stack')
(
Source code,png,hires.png,pdf)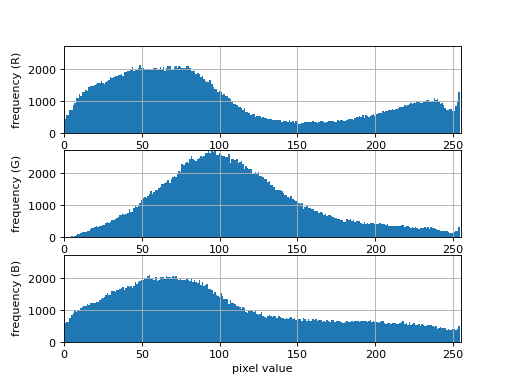
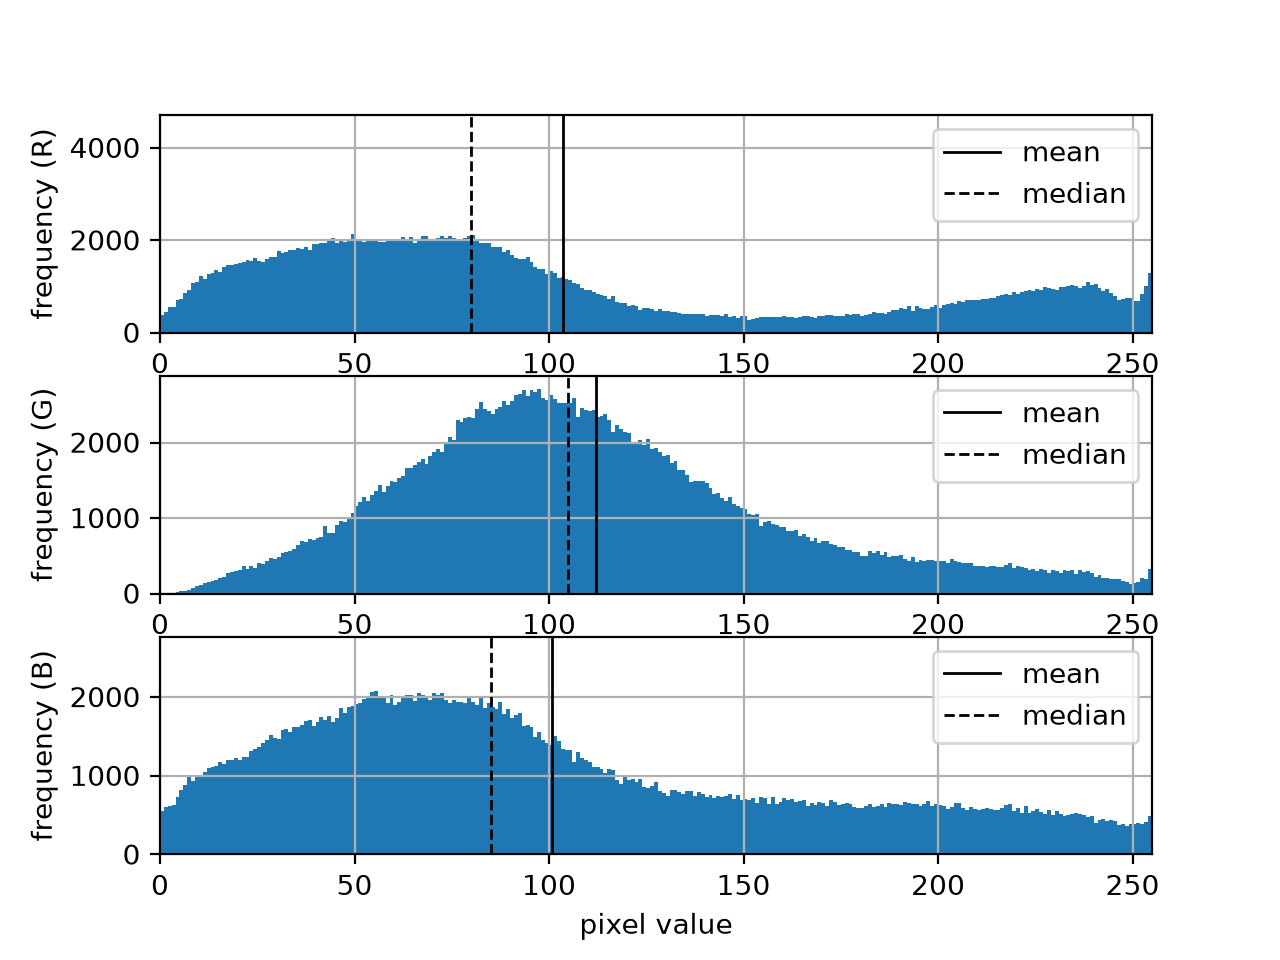
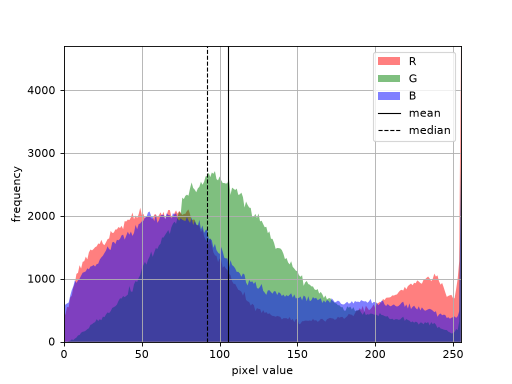
Example:
from machinevisiontoolbox import Image
img = Image.Read('flowers1.png')
hist = img.hist()
hist
hist.plot(style='overlay')
(
Source code,png,hires.png,pdf)
Note
Histogram horizontal range is controlled by
span.span='dtype'uses full datatype span (for example uint8: 0-255,float: 0.0-1.0).
span=Noneuses the finite min/max of image data.- Values outside
spanare ignored unlessclip=True, in which case they are clipped to the span endpoints.
- Values outside
- For floating point images all NaN and Inf values are removed before
computing the histogram.
Histogram is computed using
numpy.histogramindependently for each plane.
- References:
P. Corke, Robotics, Vision & Control for Python, Springer, 2023, Section 14.4.3.
- Seealso: