Image.Random#
- classmethod Image.Random(*, size: int | Sequence[int] | None = None, colororder: str | None = None, dtype: Dtype | None = None, maxval: int | float | None = None, pdf: np.ndarray | None = None, like=None) Self[source]#
Create image with random pixel values
- Parameters:
size (int, 2-tuple or 3-tuple) – image size: size, (width, height) or (width, height, nplanes)
colororder (str) – color plane names, defaults to None
dtype (str or NumPy dtype, optional) – NumPy datatype, defaults to ‘uint8’
The short-name aliases
'int','float','double','half'are also accepted and resolve to the Toolbox’s own defaults (uint8,float32,float64,float16respectively) – this matters because NumPy’s ownnp.dtype('float')resolves tofloat64, notfloat32. SeeDTYPE_ALIASES. :param maxval: maximum value for random values, defaults to None :type maxval: same asdtype, optional :param pdf: probability density function for pixel values, defaults to None :type pdf: 1D or 2D array_like, optional :param like: template image supplying defaultsize,dtypeandcolororderwhen those are not given explicitly- Returns:
image of random values
- Return type:
The dimensions can be specified by a single scalar, a 2-tuple or a 3-tuple. If a single scalar is given the image is square. If a 2-tuple is given the image has one plane, if a 3-tuple is given the last element specifies the number of planes.
Creates a new image where pixels are initialized to random values:
for an integer image the values are uniformly distributed in the range 0 to
maxval. Ifmaxvalis not given then the values span the range 0 to the maximum positive value of the datatype. For a floating image the values span the range 0.0 to 1.0.if
pdfis given then the pixel values are drawn from the given probability density function, which should be normalized to sum to 1. Ifpdfis a 1D array then the same pdf is used for all planes, if it is a 2D array then each column gives the pdf for the corresponding plane. This option is only supported foruint8images, and if given thenmaxvalis ignored.
Example:
>>> from machinevisiontoolbox import Image
>>> img = Image.Random(size=3)
>>> img.print()
   170  83  92
    46 116 243
   247 240  29
>>> img = Image.Random(size=3, colororder='RGB')
>>> img.print()
  plane R:
     111  28 157
     175  14 184
     188  30 111
  plane G:
     145 161 212
     226 175 189
     129 163 112
  plane B:
     242 205  19
     230 186 146
     110 151 190
>>> img.red().print()
   111  28 157
   175  14 184
   188  30 111
>>> img = Image.Random(size=3, dtype='float32')
>>> img.print
<bound method Image.print of Image(size=(3, 3), dtype=float32)>
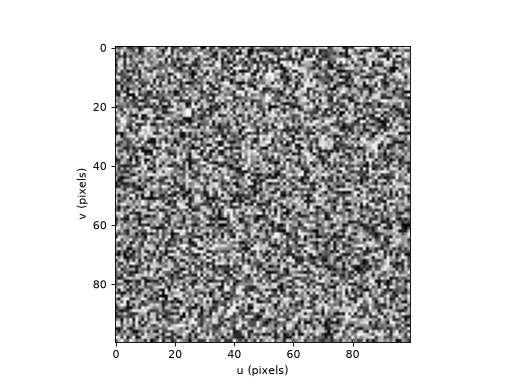
>>> Image.Random(size=100).disp()
<matplotlib.image.AxesImage object at 0x7f9a98eb6ae0>
(
Source code,png,hires.png,pdf)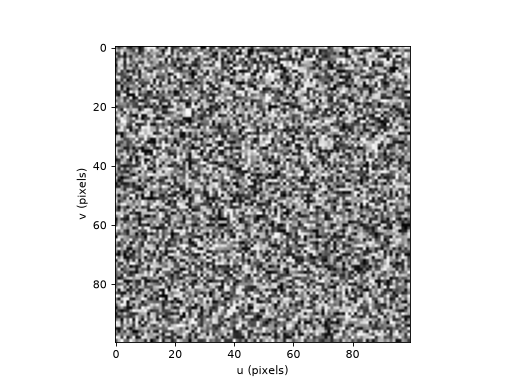
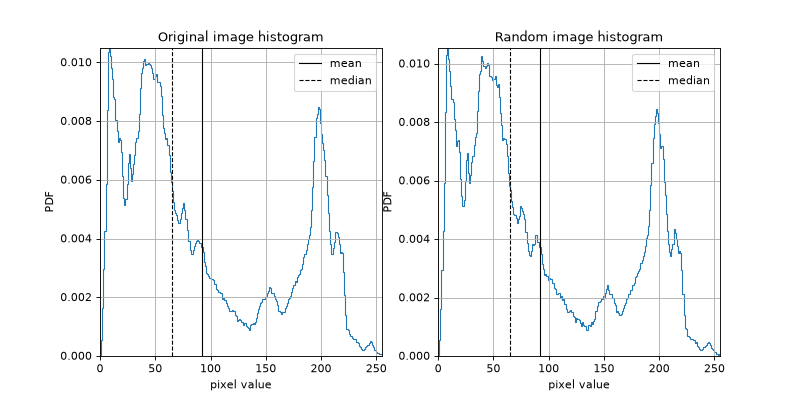
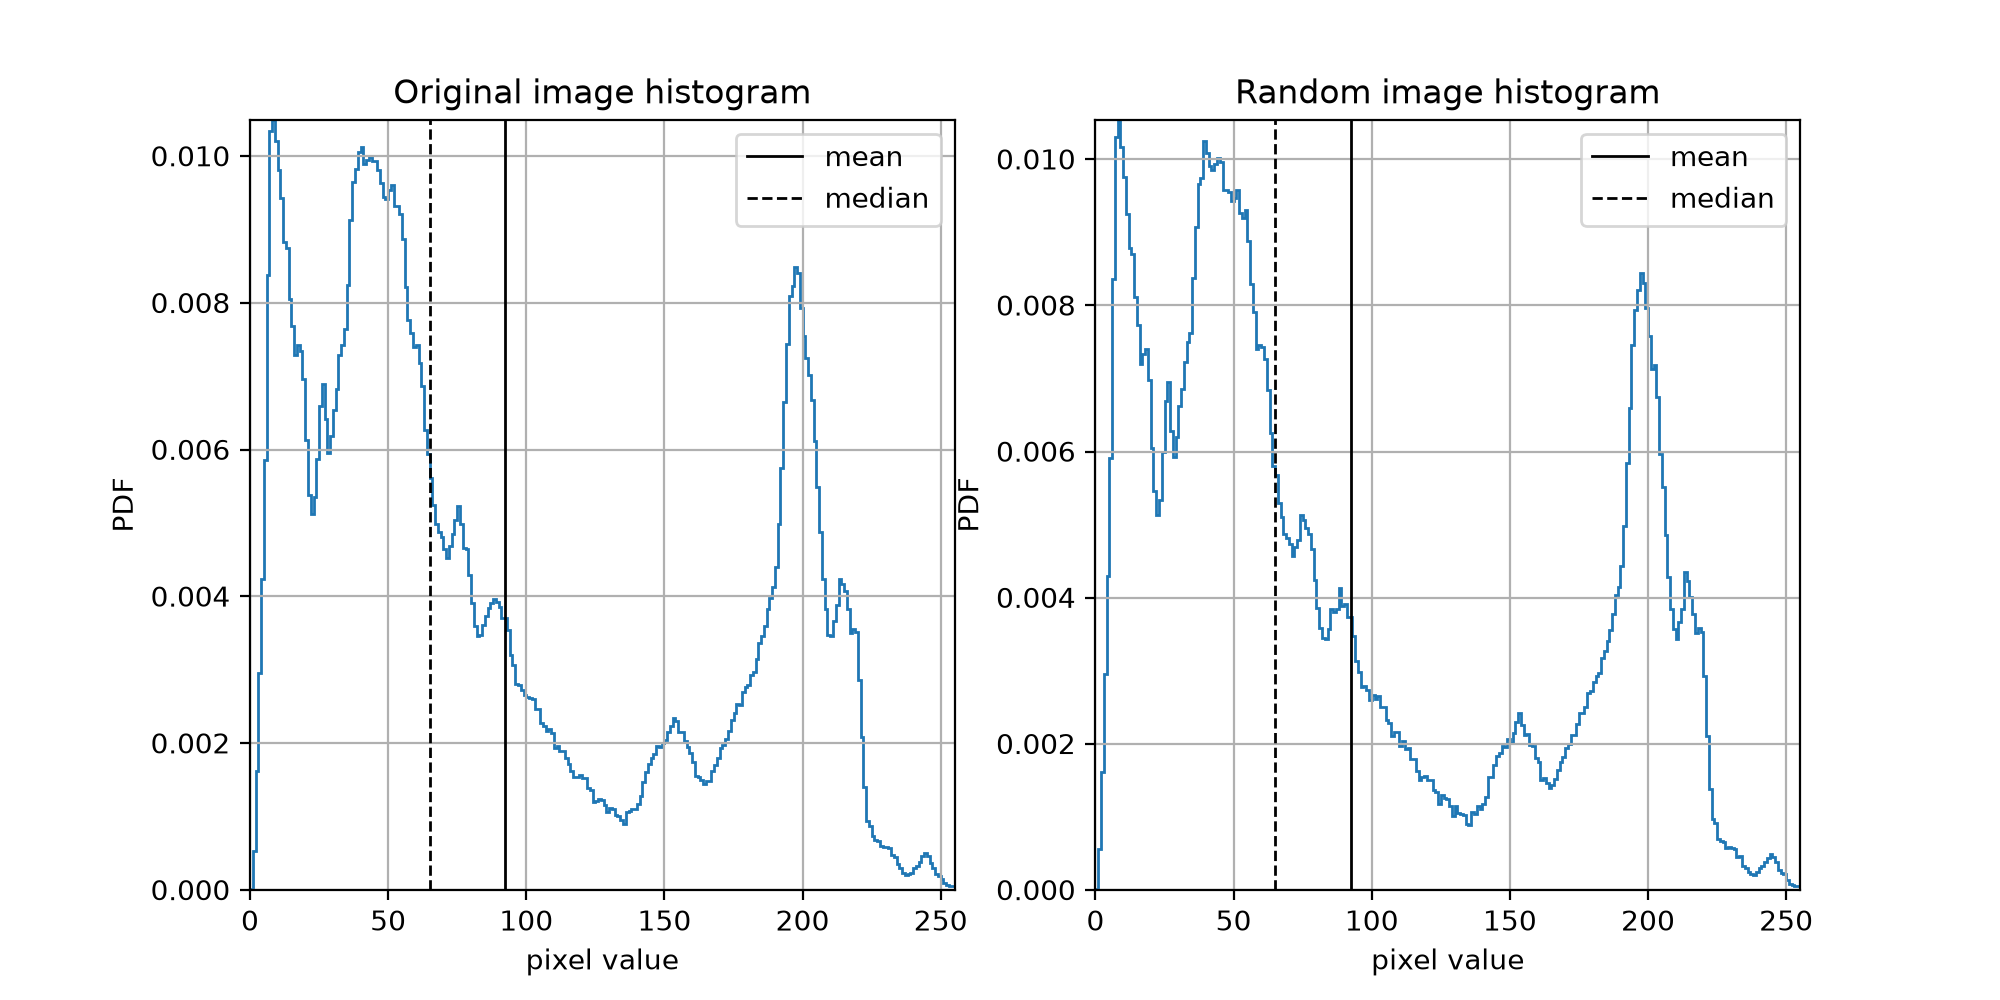
We could, for example, create a random image with the same histogram as an existing image:
>>> from machinevisiontoolbox import Image
>>> img = Image.Read("street.png")
>>> h = img.hist()
>>> h.plot('pdf')
>>> img2 = Image.Random(size=img.size, pdf=h.pdf)
>>> img2.hist().plot('pdf')
(
Source code,png,hires.png,pdf)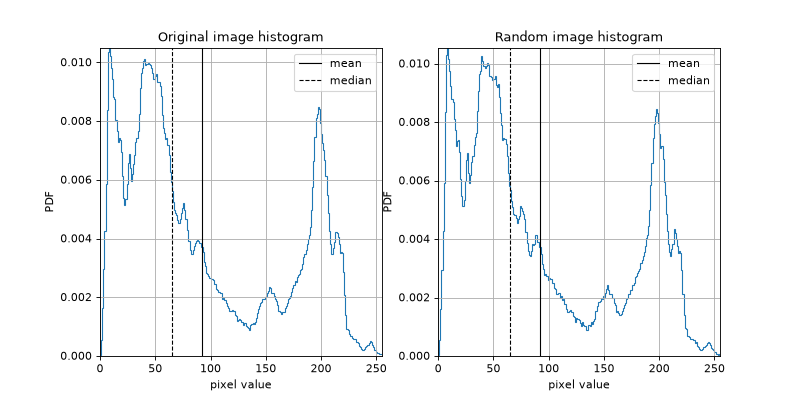
- Seealso: