Image.Sin#
- classmethod Image.Sin(cycles: int = 2, dir: str = 'x', *, size: int | Sequence[int] | None = None, dtype: Dtype | None = None, colororder: str | None = None, like=None) Self[source]#
Create image of sinusoidal intensity pattern
- Parameters:
dir (str, optional) – sinusoid direction: ‘x’ [default] or ‘y’
size (int or 2-tuple, optional) – image size, width x height, defaults to 256x256
cycles (int, optional) – Number of complete cycles, defaults to 2
dtype (str or NumPy dtype, optional) – NumPy datatype, defaults to ‘float32’
The short-name aliases
'int','float','double','half'are also accepted and resolve to the Toolbox’s own defaults (uint8,float32,float64,float16respectively) – this matters because NumPy’s ownnp.dtype('float')resolves tofloat64, notfloat32. SeeDTYPE_ALIASES. :param colororder: color plane names for the output image, defaults to None :type colororder: str or None, optional :param like: template image supplying defaultsize,dtypeandcolororderwhen those are not given explicitly- Returns:
sinusoidal pattern
- Return type:
The sinusoids are offset to have a minimum value of zero, and span the range:
float image: 0 to 1
int image: 0 to maximum positive value of the integer type
Example:
>>> from machinevisiontoolbox import Image
>>> Image.Sin(cycles=2, size=10).print()
   0.50 0.98 0.79 0.21 0.02 0.50 0.98 0.79 0.21 0.02
   0.50 0.98 0.79 0.21 0.02 0.50 0.98 0.79 0.21 0.02
   0.50 0.98 0.79 0.21 0.02 0.50 0.98 0.79 0.21 0.02
   0.50 0.98 0.79 0.21 0.02 0.50 0.98 0.79 0.21 0.02
   0.50 0.98 0.79 0.21 0.02 0.50 0.98 0.79 0.21 0.02
   0.50 0.98 0.79 0.21 0.02 0.50 0.98 0.79 0.21 0.02
   0.50 0.98 0.79 0.21 0.02 0.50 0.98 0.79 0.21 0.02
   0.50 0.98 0.79 0.21 0.02 0.50 0.98 0.79 0.21 0.02
   0.50 0.98 0.79 0.21 0.02 0.50 0.98 0.79 0.21 0.02
   0.50 0.98 0.79 0.21 0.02 0.50 0.98 0.79 0.21 0.02
>>> Image.Sin(cycles=2, size=10, dtype='uint8').print()
   127 248 202  52   6 127 248 202  52   6
   127 248 202  52   6 127 248 202  52   6
   127 248 202  52   6 127 248 202  52   6
   127 248 202  52   6 127 248 202  52   6
   127 248 202  52   6 127 248 202  52   6
   127 248 202  52   6 127 248 202  52   6
   127 248 202  52   6 127 248 202  52   6
   127 248 202  52   6 127 248 202  52   6
   127 248 202  52   6 127 248 202  52   6
   127 248 202  52   6 127 248 202  52   6
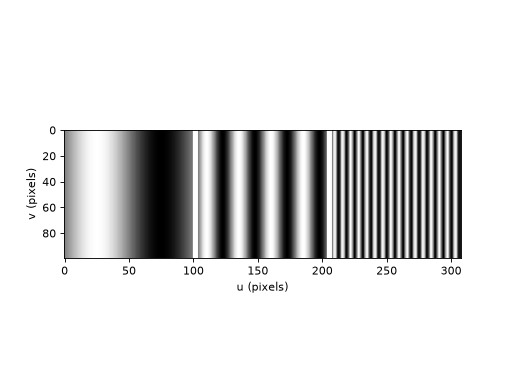
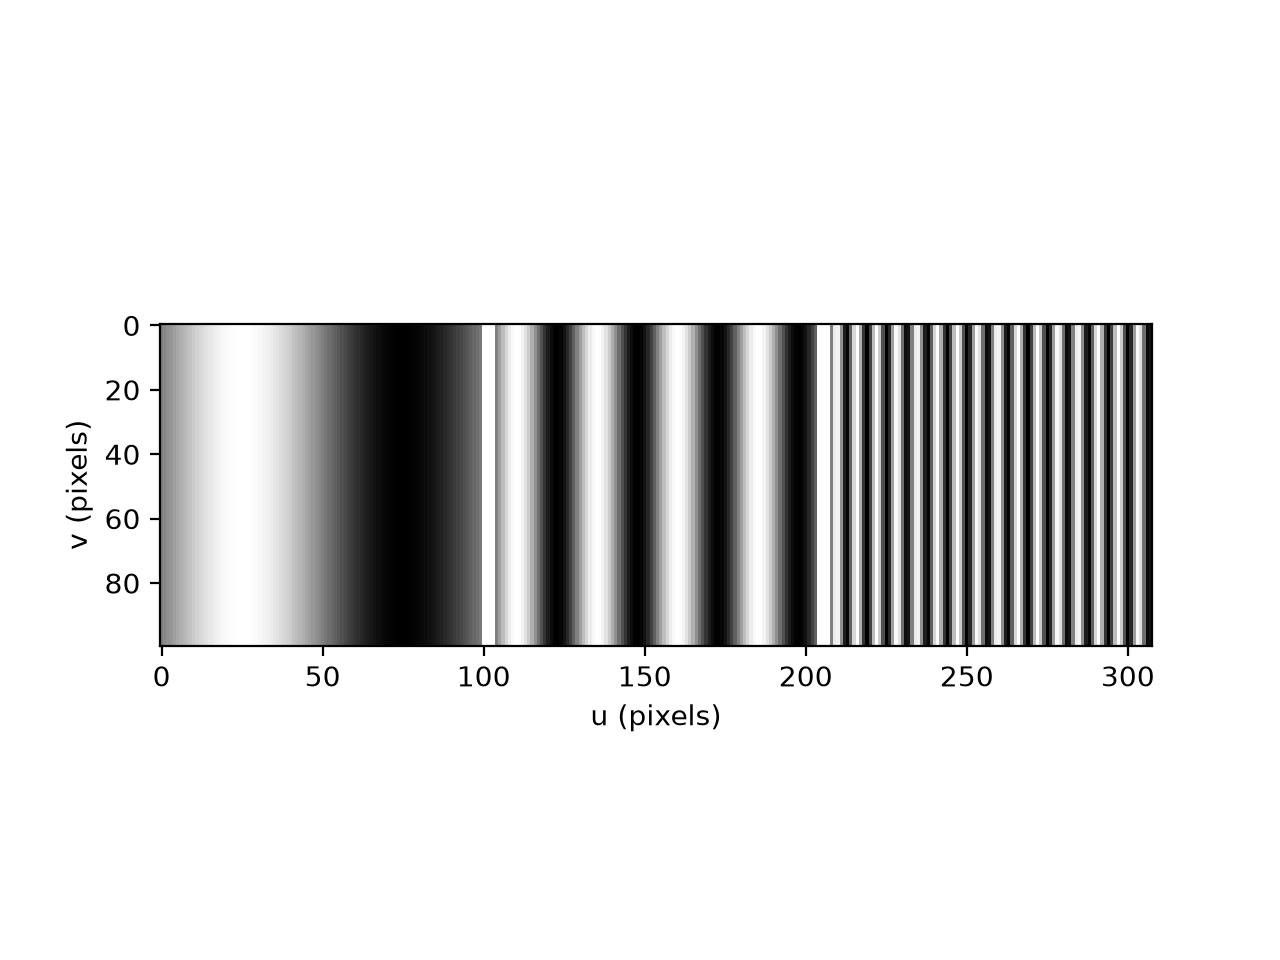
cyclesequal to 1, 4 and 18:(
Source code,png,hires.png,pdf)