Mobile robot path planning
A set of path planners for robots operating in planar environments with
configuration \(\vec{q} \in \mathbb{R}^2\) or \(\vec{q} \in \SE{2}\).
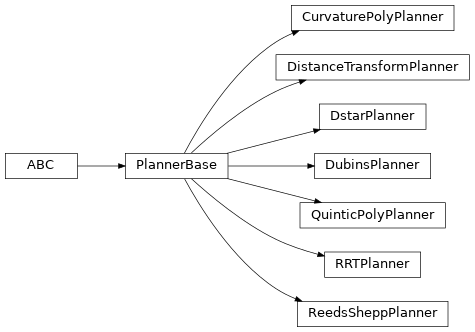
All inherit from PlannerBase.
Some planners are based on code from the PathPlanning category of PythonRobotics by Atsushi Sakai.
Planner |
Plans in |
Discrete/Continuous |
Obstacle avoidance |
|---|---|---|---|
\(\mathbb{R}^2\) |
discrete |
yes |
|
\(\mathbb{R}^2\) |
discrete |
yes |
|
\(\mathbb{R}^2\) |
discrete |
yes |
|
\(\mathbb{R}^2\) |
continuous |
yes |
|
\(\SE{2}\) |
discrete |
yes |
|
\(\SE{2}\) |
continuous |
no |
|
\(\SE{2}\) |
continuous |
no |
|
\(\SE{2}\) |
continuous |
no |
|
\(\SE{2}\) |
continuous |
no |
|
\(\SE{2}\) |
continuous |
yes |
Discrete (Grid-based) planners
Distance transform planner
- class roboticstoolbox.mobile.DistanceTransformPlanner(occgrid=None, metric='euclidean', **kwargs)[source]
Bases:
PlannerBaseDistance transform path planner
- Parameters
occgrid (
BinaryOccGridor ndarray(h,w)) – occupancy gridmetric (str optional) – distane metric, one of: “euclidean” [default], “manhattan”
kwargs – common planner options, see
PlannerBase
Feature
Capability
Plan
\(\mathbb{R}^2\), discrete
Obstacle avoidance
Yes, occupancy grid
Curvature
Discontinuous
Motion
Omnidirectional
Creates a planner that finds the path between two points in the 2D grid using omnidirectional motion and avoiding occupied cells. The path comprises a set of 4- or -way connected points in adjacent cells. Also known as the wavefront, grassfire or brushfire planning algorithm.
The map is described by a 2D occupancy
occgridwhose elements are zero if traversable of nonzero if untraversable, ie. an obstacle.The cells are assumed to be unit squares. Crossing the cell horizontally or vertically is a travel distance of 1, and for the Euclidean distance measure, the crossing the cell diagonally is a distance of \(\sqrt{2}\).
Example:
  File "/opt/hostedtoolcache/Python/3.7.15/x64/lib/python3.7/site-packages/roboticstoolbox/mobile/PlannerBase.py", line 326, in validate_endpoint
    p = base.getvector(p, self._ndims, dtype=dtype)
NameError: name 'base' is not defined
Traceback (most recent call last):
  File "<input>", line 1, in <module>
NameError: name 'dx' is not defined
Traceback (most recent call last):
  File "<input>", line 1, in <module>
NameError: name 'dx' is not defined
Traceback (most recent call last):
  File "<input>", line 1, in <module>
NameError: name 'path' is not defined
Warning
The distance planner is iterative and implemented in Python, will be slow for very large occupancy grids.
- Author
Peter Corke
- Seealso
- property metric
Get the distance metric
- Returns
Get the metric, either “euclidean” or “manhattan”
- Return type
str
- property distancemap
Get the distance map
- Returns
distance map
- Return type
ndarray(h,w)
The 2D array, the same size as the passed occupancy grid, has elements equal to nan if they contain an obstacle, otherwise the minimum obstacle-free distance to the goal using the particular distance metric.
- plan(goal=None, animate=False, verbose=False)[source]
Plan path using distance transform
- Parameters
goal (array_like(2), optional) – goal position \((x, y)\), defaults to previously set value
Compute the distance transform for all non-obstacle cells, which is the minimum obstacle-free distance to the goal using the particular distance metric.
- Seealso
- next(position)[source]
Find next point on the path
- Parameters
position (array_like(2)) – current robot position
- Raises
RuntimeError – no plan has been computed
- Returns
next robot position
- Return type
ndarray(2)
Return the robot position that is one step closer to the goal. Called by
query()to find a path from start to goal.
- plot_3d(path=None, ls=None)[source]
Plot path on 3D cost surface
- Parameters
path (ndarray(N,2), optional) – robot path, defaults to None
ls (dict, optional) – dictionary of Matplotlib linestyle options, defaults to None
- Returns
Matplotlib 3D axes
- Return type
Axes
Creates a 3D plot showing distance from the goal as a cost surface. Overlays the path if given.
Warning
The visualization is poor because of Matplotlib’s poor hidden line/surface handling.
- property goal
Set/get goal point or configuration (superclass)
- Getter
Return goal pointor configuration
- Return type
ndarray(2) or ndarray(3)
- Setter
Set goal point or configuration
- Param
array_like(2) or array_like(3)
The goal is either a point \((x, y)\) or a configuration \((x, y, \theta)\).
- Seealso
- isoccupied(p)
Test if point is occupied (superclass)
- Parameters
p (array_like(2)) – world coordinate (x, y)
- Returns
occupancy status of corresponding grid cell
- Return type
bool
The world coordinate is transformed and the status of the occupancy grid cell is returned. If the point lies outside the bounds of the occupancy grid return True (obstacle)
If there is no occupancy grid this function always returns False (free).
- Seealso
occgrid()validate_endpoint()BinaryOccGrid.isoccupied()
- property occgrid
Occupancy grid
- Returns
occupancy grid used for planning
- Return type
OccGridor subclass or None
Returns the occupancy grid that was optionally inflated at constructor time.
- Seealso
- plot(path=None, line=None, line_r=None, configspace=False, unwrap=True, direction=None, background=True, path_marker=None, path_marker_reverse=None, start_marker=None, goal_marker=None, start_vehicle=None, goal_vehicle=None, start=None, goal=None, ax=None, block=False, bgargs={}, **unused)
Plot vehicle path (superclass)
- Parameters
path ((N, 2) or ndarray(N, 3)) – path, defaults to None
direction (array_like(N), optional) – travel direction associated with each point on path, is either >0 or <0, defaults to None
line (sequence of dict of arguments for
plot) – line style for forward motion, default is striped yellow on blackline_r (sequence of dict of arguments for
plot) – line style for reverse motion, default is striped red on blackconfigspace (bool, optional) – plot the path in 3D configuration space, input must be 3xN. Start and goal style will be given by
qstart_markerandqgoal_marker, defaults to Falseunwrap (bool, optional) – for configuration space plot unwrap \(\theta\) so there are no discontinuities at \(\pm \pi\), defaults to True
background (bool, optional) – plot occupancy grid if present, default True
start_marker (dict, optional) – style for marking start point
goal_marker (dict, optional) – style for marking goal point
start_vehicle (dict) – style for vehicle animation object at start configuration
goal_vehicle (dict) – style for vehicle animation object at goal configuration
start (array_like(2) or array_like(3), optional) – start position \((x, y)\) or configuration \((x, y, \theta)\), defaults to value previously set
goal (array_like(2) or array_like(3), optional) – goal position \((x, y)\) or configuration \((x, y, \theta)\), defaults to value previously set
bgargs (dict, optional) – arguments passed to
plot_bg(), defaults to Noneax (matplotlib axes) – axes to plot into
block (bool, optional) – block after displaying the plot
Plots the start and goal location/pose if they are specified by
startorgoalor were set by the object constructor orplanorquerymethod.If the
startandgoalhave length 2, planning in \(\mathbb{R}^2\), then markers are drawn using styles specified bystart_markerandend_markerwhich are dicts using Matplotlib keywords, for example:planner.plot(path, start=dict(marker='s', color='b'))
If the
startandgoalhave length 3, planning in \(\SE{2}\), andconfigspaceis False, then direction-indicating markers are used to display start and goal configuration. These are also given as dicts but have two items:'shape'which is the shape of the polygonal marker and is either'triangle'or'car'. The second item'args'is passed tobase.plot_poly()and Matplotlib and could have values such asfilled=Trueorcolor.If
configspaceis False then a 3D plot is created and the start and goal are indicated by Matplotlib markers specified by the dictsstart_markerandend_markerDefault values are provided for all markers:
the start point is a circle
the goal point is a star
the start vehicle style is a
VehiclePolygon(shape='car')as an unfilled outlinethe goal vehicle style is a
VehiclePolygon(shape='car')as a transparent filled shape
If
backgroundis True then the background of the plot is either or both of:the occupancy grid
the distance field of the planner
Additional arguments
bgargscan be passed through toplot_bg()If
pathis specified it has one column per point and either 2 or 3 rows:2 rows describes motion in the \(xy\)-plane and a 2D plot is created
3 rows describes motion in the \(xy\theta\)-configuration space. By default only the \(xy\)-plane is plotted unless
configspaceis True in which case motion in \(xy\theta\)-configuration space is shown as a 3D plot.
If the planner supports bi-directional motion then the
directionoption gives the direction for each point on the path.Forward motion segments are drawn using style information from
linewhile reverse motion segments are drawn using style information fromline_r. These are each a sequence of dicts of Matplotlib plot options which can draw an arbitrary number of lines on top of each other. The default:line = ( {color:'black', linewidth:4}, {color:'yellow', linewidth:3, dashes:(5,5)} )
will draw a blackline of width 4 with a dashed yellow line of width 3 plotted on top, giving a line of alternating black and yellow dashes.
- Seealso
plot_bg()base.plot_poly()
- plot_bg(distance=None, cmap='gray', ax=None, inflated=True, colorbar=True, **unused)
Plot background (superclass)
- Parameters
distance (ndarray(N,M), optional) – override distance field, defaults to None
cmap (str or Colormap, optional) – Specify a colormap for the distance field, defaults to ‘gray’
Displays the background which is either the occupancy grid or a distance field. The distance field encodes the distance of a point from the goal, small distance is dark, a large distance is bright.
- If the planner has an occupancy grid then that will be displayed with:
free cells in white
occupied cells in red
inflated occupied cells in pink
If distance is provided, or the planner has a distancemap attribute the the distance field will be used as the background and obstacle cells (actual or inflated) will be shown in red. A colorbar is added.
- query(start=None, goal=None, dtype=None, next=True, animate=False, movie=None)
Find a path from start to goal using planner (superclass)
- Parameters
start (array_like(), optional) – start position \((x, y)\) or configuration \((x, y, \theta)\), defaults to value specified to constructor
goal (array_like(), optional) – goal position \((x, y)\) or configuration \((x, y, \theta)\), defaults to value specified to constructor
dtype (str, optional) – data type for point coordinates, defaults to None
next (bool, optional) – invoke
next()method of class, defaults to Trueanimate (bool, optional) – show the vehicle path, defaults to False
- Returns
path from start to goal, one point \((x, y)\) or configuration \((x, y, \theta)\) per row
- Return type
ndarray(N,2) or ndarray(N,3)
Find a path from
starttogoalusing a previously computed plan.This is a generic method that works for any planner (\(\mathbb{R}^2\) or \(\SE{2}\)) that can incrementally determine the next point on the path. The method performs the following steps:
- property start
Set/get start point or configuration (superclass)
- Getter
Return start point or configuration
- Return type
ndarray(2) or ndarray(3)
- Setter
Set start point or configuration
- Param
array_like(2) or array_like(3)
The start is either a point \((x, y)\) or a configuration \((x, y, \theta)\).
- Seealso
- validate_endpoint(p, dtype=None)
Validate start or goal point
- Parameters
p (array_like(2)) – the point
dtype (str, optional) – data type for point coordinates, defaults to None
- Raises
ValueError – point is inside obstacle
- Returns
point as a NumPy array of specified dtype
- Return type
ndarray(2)
The coordinate is tested to be a free cell in the occupancy grid.
- Seealso
- property verbose
Get verbosity
- Returns
verbosity
- Return type
bool
If
verbosityprint more diagnostic messages to the planner’s message channel.
D* planner
- class roboticstoolbox.mobile.DstarPlanner(costmap=None, **kwargs)[source]
Bases:
PlannerBaseD* path planner
- Parameters
costmap (OccGrid or ndarray(w,h)) – traversability costmap
kwargs – common planner options, see
PlannerBase
Feature
Capability
Plan
\(\mathbb{R}^2\), discrete
Obstacle avoidance
Yes, occupancy grid
Curvature
Discontinuous
Motion
Omnidirectional
Creates a planner that finds the minimum-cost path between two points in the plane using omnidirectional motion. The path comprises a set of 8-way connected points in adjacent cells.
The map is described by a 2D
costmapwhose elements indicate the cost of traversing that cell. The cost of diagonal traverse is \(\sqrt{2}\) the value of the cell. An infinite cost indicates an untraversable cell or obstacle.Example:
  File "/opt/hostedtoolcache/Python/3.7.15/x64/lib/python3.7/site-packages/roboticstoolbox/mobile/PlannerBase.py", line 326, in validate_endpoint
    p = base.getvector(p, self._ndims, dtype=dtype)
NameError: name 'base' is not defined
Traceback (most recent call last):
  File "<input>", line 1, in <module>
NameError: name 'ds' is not defined
Traceback (most recent call last):
  File "<input>", line 1, in <module>
NameError: name 'ds' is not defined
Traceback (most recent call last):
  File "<input>", line 1, in <module>
NameError: name 'path' is not defined
Traceback (most recent call last):
  File "<input>", line 1, in <module>
NameError: name 'status' is not defined
- Thanks
based on D* grid planning included from Python Robotics
- Seealso
- plan(goal=None, animate=False, progress=True, summary=False)[source]
Plan D* path
- Parameters
goal (array_like(2), optional) – goal position \((x, y)\), defaults to previously set value
animate (bool, optional) – animate the planning algorithm iterations, defaults to False
progress (bool, optional) – show progress bar, defaults to True
Compute the minimum-cost obstacle-free distance to the goal from all points in the grid.
- property nexpand
Number of node expansions
- Returns
number of expansions
- Return type
int
This number will increase during initial planning, and also if replanning is invoked during the
query().
- query(start, sensor=None, animate=False, verbose=False)[source]
Find path with replanning
- Parameters
start (array_like(2)) – start position \((x,y)\)
sensor (callable, optional) – sensor function, defaults to None
animate (bool, optional) – animate the motion of the robot, defaults to False
verbose (bool, optional) – display detailed diagnostic information about D* operations, defaults to False
- Returns
path from start to goal, one point \((x, y)\) per row
- Return type
ndarray(N,2)
If
sensoris None then the plan determined by theplanphase is used unaltered.If
sensoris not None it must be callable, and is called at each step of the path with the current robot coordintes:sensor((x, y))
and mimics the behaviour of a simple sensor onboard the robot which can dynamically change the costmap. The function return a list (0 or more) of 3-tuples (x, y, newcost) which are the coordinates of cells and their cost. If the cost has changed this will trigger D* incremental replanning. In this case the value returned by
nexpand()will increase, according to the severity of the replanning.- Seealso
- property goal
Set/get goal point or configuration (superclass)
- Getter
Return goal pointor configuration
- Return type
ndarray(2) or ndarray(3)
- Setter
Set goal point or configuration
- Param
array_like(2) or array_like(3)
The goal is either a point \((x, y)\) or a configuration \((x, y, \theta)\).
- Seealso
- property occgrid
Occupancy grid
- Returns
occupancy grid used for planning
- Return type
OccGridor subclass or None
Returns the occupancy grid that was optionally inflated at constructor time.
- Seealso
validate_endpoint()isoccupied()
- plot(path=None, line=None, line_r=None, configspace=False, unwrap=True, direction=None, background=True, path_marker=None, path_marker_reverse=None, start_marker=None, goal_marker=None, start_vehicle=None, goal_vehicle=None, start=None, goal=None, ax=None, block=False, bgargs={}, **unused)
Plot vehicle path (superclass)
- Parameters
path ((N, 2) or ndarray(N, 3)) – path, defaults to None
direction (array_like(N), optional) – travel direction associated with each point on path, is either >0 or <0, defaults to None
line (sequence of dict of arguments for
plot) – line style for forward motion, default is striped yellow on blackline_r (sequence of dict of arguments for
plot) – line style for reverse motion, default is striped red on blackconfigspace (bool, optional) – plot the path in 3D configuration space, input must be 3xN. Start and goal style will be given by
qstart_markerandqgoal_marker, defaults to Falseunwrap (bool, optional) – for configuration space plot unwrap \(\theta\) so there are no discontinuities at \(\pm \pi\), defaults to True
background (bool, optional) – plot occupancy grid if present, default True
start_marker (dict, optional) – style for marking start point
goal_marker (dict, optional) – style for marking goal point
start_vehicle (dict) – style for vehicle animation object at start configuration
goal_vehicle (dict) – style for vehicle animation object at goal configuration
start (array_like(2) or array_like(3), optional) – start position \((x, y)\) or configuration \((x, y, \theta)\), defaults to value previously set
goal (array_like(2) or array_like(3), optional) – goal position \((x, y)\) or configuration \((x, y, \theta)\), defaults to value previously set
bgargs (dict, optional) – arguments passed to
plot_bg(), defaults to Noneax (matplotlib axes) – axes to plot into
block (bool, optional) – block after displaying the plot
Plots the start and goal location/pose if they are specified by
startorgoalor were set by the object constructor orplanorquerymethod.If the
startandgoalhave length 2, planning in \(\mathbb{R}^2\), then markers are drawn using styles specified bystart_markerandend_markerwhich are dicts using Matplotlib keywords, for example:planner.plot(path, start=dict(marker='s', color='b'))
If the
startandgoalhave length 3, planning in \(\SE{2}\), andconfigspaceis False, then direction-indicating markers are used to display start and goal configuration. These are also given as dicts but have two items:'shape'which is the shape of the polygonal marker and is either'triangle'or'car'. The second item'args'is passed tobase.plot_poly()and Matplotlib and could have values such asfilled=Trueorcolor.If
configspaceis False then a 3D plot is created and the start and goal are indicated by Matplotlib markers specified by the dictsstart_markerandend_markerDefault values are provided for all markers:
the start point is a circle
the goal point is a star
the start vehicle style is a
VehiclePolygon(shape='car')as an unfilled outlinethe goal vehicle style is a
VehiclePolygon(shape='car')as a transparent filled shape
If
backgroundis True then the background of the plot is either or both of:the occupancy grid
the distance field of the planner
Additional arguments
bgargscan be passed through toplot_bg()If
pathis specified it has one column per point and either 2 or 3 rows:2 rows describes motion in the \(xy\)-plane and a 2D plot is created
3 rows describes motion in the \(xy\theta\)-configuration space. By default only the \(xy\)-plane is plotted unless
configspaceis True in which case motion in \(xy\theta\)-configuration space is shown as a 3D plot.
If the planner supports bi-directional motion then the
directionoption gives the direction for each point on the path.Forward motion segments are drawn using style information from
linewhile reverse motion segments are drawn using style information fromline_r. These are each a sequence of dicts of Matplotlib plot options which can draw an arbitrary number of lines on top of each other. The default:line = ( {color:'black', linewidth:4}, {color:'yellow', linewidth:3, dashes:(5,5)} )
will draw a blackline of width 4 with a dashed yellow line of width 3 plotted on top, giving a line of alternating black and yellow dashes.
- Seealso
plot_bg()base.plot_poly()
- plot_bg(distance=None, cmap='gray', ax=None, inflated=True, colorbar=True, **unused)
Plot background (superclass)
- Parameters
distance (ndarray(N,M), optional) – override distance field, defaults to None
cmap (str or Colormap, optional) – Specify a colormap for the distance field, defaults to ‘gray’
Displays the background which is either the occupancy grid or a distance field. The distance field encodes the distance of a point from the goal, small distance is dark, a large distance is bright.
- If the planner has an occupancy grid then that will be displayed with:
free cells in white
occupied cells in red
inflated occupied cells in pink
If distance is provided, or the planner has a distancemap attribute the the distance field will be used as the background and obstacle cells (actual or inflated) will be shown in red. A colorbar is added.
- property start
Set/get start point or configuration (superclass)
- Getter
Return start point or configuration
- Return type
ndarray(2) or ndarray(3)
- Setter
Set start point or configuration
- Param
array_like(2) or array_like(3)
The start is either a point \((x, y)\) or a configuration \((x, y, \theta)\).
- Seealso
- validate_endpoint(p, dtype=None)
Validate start or goal point
- Parameters
p (array_like(2)) – the point
dtype (str, optional) – data type for point coordinates, defaults to None
- Raises
ValueError – point is inside obstacle
- Returns
point as a NumPy array of specified dtype
- Return type
ndarray(2)
The coordinate is tested to be a free cell in the occupancy grid.
- Seealso
isoccupied()occgrid()
- property verbose
Get verbosity
- Returns
verbosity
- Return type
bool
If
verbosityprint more diagnostic messages to the planner’s message channel.
PRM planner
- class roboticstoolbox.mobile.PRMPlanner(occgrid=None, npoints=100, dist_thresh=None, **kwargs)[source]
Bases:
PlannerBaseDistance transform path planner
- Parameters
occgrid (
BinaryOccGridor ndarray(h,w)) – occupancy gridnpoints (int, optional) – number of random points, defaults to 100
dist_thresh (float, optional) – distance threshold, a new point is only added to the roadmap if it is closer than this distance to an existing vertex, defaults to None
Planner – probabilistic roadmap path planner
kwargs – common planner options, see
PlannerBase
Feature
Capability
Plan
Cartesian space
Obstacle avoidance
Yes, occupancy grid
Curvature
Discontinuous
Motion
Omnidirectional
Creates a planner that finds the path between two points in the plane using omnidirectional motion. The path comprises a set of way points.
Example:
  File "/opt/hostedtoolcache/Python/3.7.15/x64/lib/python3.7/site-packages/roboticstoolbox/mobile/PlannerBase.py", line 326, in validate_endpoint
    p = base.getvector(p, self._ndims, dtype=dtype)
NameError: name 'base' is not defined
Traceback (most recent call last):
  File "<input>", line 1, in <module>
NameError: name 'path' is not defined
- Author
Peter Corke
- Seealso
- property npoints
Number of points in the roadmap
- Returns
Number of points
- Return type
int
- property dist_thresh
Distance threshold
- Returns
distance threshold
- Return type
float
Edges are created between points if the distance between them is less than this value.
- property graph
Roadmap graph
- Returns
roadmap as an undirected graph
- Return type
pgraph.UGraphinstance
- plan(npoints=None, dist_thresh=None, animate=None)[source]
Plan PRM path
- Parameters
npoints (int, optional) – number of random points, defaults to
npointsgiven to constructordist_thresh (float, optional) – distance threshold, defaults to
dist_threshgiven to constructoranimate (bool, optional) – animate the planning algorithm iterations, defaults to False
Create a probablistic roadmap. This is a graph connecting points randomly selected from the free space of the occupancy grid. Edges are created between points if the distance between them is less than
dist_thresh.The roadmap is a pgraph
UGraphUGraphUGraph
- query(start, goal, **kwargs)[source]
Find a path from start to goal using planner
- Parameters
start (array_like(), optional) – start position \((x, y)\), defaults to previously set value
goal (array_like(), optional) – goal position \((x, y)\), defaults to previously set value
kwargs – options passed to
PlannerBase.query()
- Returns
path from start to goal, one point \((x, y)\) per row
- Return type
ndarray(N,2)
The path is a sparse sequence of waypoints, with variable distance between them.
Warning
Waypoints 1 to N-2 are part of the roadmap, while waypoints 0 and N-1 are the start and goal respectively. The first and last motion segment is not guaranteed to be obstacle free.
- plot(*args, vertex={}, edge={}, **kwargs)[source]
Plot PRM path
- Parameters
vertex (dict, optional) – vertex style, defaults to {}
edge (dict, optional) – edge style, defaults to {}
Displays:
the planner background (obstacles)
the roadmap graph
the path
- Seealso
UGraph.plot()
- property goal
Set/get goal point or configuration (superclass)
- Getter
Return goal pointor configuration
- Return type
ndarray(2) or ndarray(3)
- Setter
Set goal point or configuration
- Param
array_like(2) or array_like(3)
The goal is either a point \((x, y)\) or a configuration \((x, y, \theta)\).
- Seealso
- property occgrid
Occupancy grid
- Returns
occupancy grid used for planning
- Return type
OccGridor subclass or None
Returns the occupancy grid that was optionally inflated at constructor time.
- Seealso
validate_endpoint()isoccupied()
- property start
Set/get start point or configuration (superclass)
- Getter
Return start point or configuration
- Return type
ndarray(2) or ndarray(3)
- Setter
Set start point or configuration
- Param
array_like(2) or array_like(3)
The start is either a point \((x, y)\) or a configuration \((x, y, \theta)\).
- Seealso
- validate_endpoint(p, dtype=None)
Validate start or goal point
- Parameters
p (array_like(2)) – the point
dtype (str, optional) – data type for point coordinates, defaults to None
- Raises
ValueError – point is inside obstacle
- Returns
point as a NumPy array of specified dtype
- Return type
ndarray(2)
The coordinate is tested to be a free cell in the occupancy grid.
- Seealso
isoccupied()occgrid()
- property verbose
Get verbosity
- Returns
verbosity
- Return type
bool
If
verbosityprint more diagnostic messages to the planner’s message channel.
Lattice planner
- class roboticstoolbox.mobile.LatticePlanner(costs=None, root=(0, 0, 0), **kwargs)[source]
Bases:
PlannerBaseLattice planner
- Parameters
costs (array_like(3), optional) – cost for straight, left-turn, right-turn, defaults to \((1, \pi/2, \pi/2)\)
root (array_like(3), optional) – configuration of root node, defaults to (0,0,0)
kwargs – arguments passed to
PlannerBaseconstructor
Feature
Capability
Plan
\(\SE{2}\)
Obstacle avoidance
Yes, occupancy grid
Curvature
Discontinuous
Motion
Forwards only
The lattice planner incrementally builds a graph from the root vertex, at each iteration adding three edges to the graph:
code
direction
‘S’
straight ahead
‘L’
turn left
‘R’
turn right
If the configuration is already in the graph, the edge connects to that existing vertex. The vertex is named after the sequence of moves required to reach it from the root. This means, that any configuration, ie. \((x, y, \theta)\) can be reached by multiple paths and potentially have multiple names. The first name assigned to a vertex is permanent and is not overriden.
If an occupancy grid exists and the configuration is an obstacle, then the vertex is not added.
The path through the lattice is found using A* graph search, and
costschanges the weighting for path costs at query time.Example:
>>> from roboticstoolbox import LatticePlanner
>>> import numpy as np
>>> lattice = LatticePlanner();
>>> lattice.plan(iterations=6)
>>> path, status = lattice.query(start=(0, 0, 0), goal=(1, 2, np.pi/2))
>>> print(path.T)
[[0.     1.     1.    ]
 [0.     1.     2.    ]
 [0.     1.5708 1.5708]]
>>> print(status)
LatticeStatus(cost=2.5707963267948966, segments=['L', 'S'], edges=[Edge{[0] -- [0L], cost=1.571}, Edge{[0L] -- [0LS], cost=1}])
- Seealso
- plan(iterations=None, verbose=False, summary=False)[source]
Create a lattice plan
- Parameters
iterations (int, optional) – number of iterations, defaults to None
verbose (bool, optional) – show frontier and added vertices/edges at each iteration, defaults to False
If an occupancy grid exists the if
iterationsis None the area of the grid will be completely filled.- Seealso
- query(start, goal)[source]
Find a path through the lattice
- Parameters
start (array_like(3), optional) – start configuration \((x, y, \theta)\)
goal (array_like(3), optional) – goal configuration \((x, y, \theta)\)
- Returns
path and status
- Return type
ndarray(N,3), namedtuple
The returned status value has elements:
Element
Description
costpath cost
segmentsa list containing the type of each path segment as a single letter code: either “L”, “R” or “S” for left turn, right turn or straight line respectively.
edgessuccessive edges of the graph
LatticeEdgetype- Seealso
- plot(path=None, **kwargs)[source]
Plot vehicle path (superclass)
- Parameters
path ((N, 2) or ndarray(N, 3)) – path, defaults to None
direction (array_like(N), optional) – travel direction associated with each point on path, is either >0 or <0, defaults to None
line (sequence of dict of arguments for
plot) – line style for forward motion, default is striped yellow on blackline_r (sequence of dict of arguments for
plot) – line style for reverse motion, default is striped red on blackconfigspace (bool, optional) – plot the path in 3D configuration space, input must be 3xN. Start and goal style will be given by
qstart_markerandqgoal_marker, defaults to Falseunwrap (bool, optional) – for configuration space plot unwrap \(\theta\) so there are no discontinuities at \(\pm \pi\), defaults to True
background (bool, optional) – plot occupancy grid if present, default True
start_marker (dict, optional) – style for marking start point
goal_marker (dict, optional) – style for marking goal point
start_vehicle (dict) – style for vehicle animation object at start configuration
goal_vehicle (dict) – style for vehicle animation object at goal configuration
start (array_like(2) or array_like(3), optional) – start position \((x, y)\) or configuration \((x, y, \theta)\), defaults to value previously set
goal (array_like(2) or array_like(3), optional) – goal position \((x, y)\) or configuration \((x, y, \theta)\), defaults to value previously set
bgargs (dict, optional) – arguments passed to
plot_bg(), defaults to Noneax (matplotlib axes) – axes to plot into
block (bool, optional) – block after displaying the plot
Plots the start and goal location/pose if they are specified by
startorgoalor were set by the object constructor orplanorquerymethod.If the
startandgoalhave length 2, planning in \(\mathbb{R}^2\), then markers are drawn using styles specified bystart_markerandend_markerwhich are dicts using Matplotlib keywords, for example:planner.plot(path, start=dict(marker='s', color='b'))
If the
startandgoalhave length 3, planning in \(\SE{2}\), andconfigspaceis False, then direction-indicating markers are used to display start and goal configuration. These are also given as dicts but have two items:'shape'which is the shape of the polygonal marker and is either'triangle'or'car'. The second item'args'is passed tobase.plot_poly()and Matplotlib and could have values such asfilled=Trueorcolor.If
configspaceis False then a 3D plot is created and the start and goal are indicated by Matplotlib markers specified by the dictsstart_markerandend_markerDefault values are provided for all markers:
the start point is a circle
the goal point is a star
the start vehicle style is a
VehiclePolygon(shape='car')as an unfilled outlinethe goal vehicle style is a
VehiclePolygon(shape='car')as a transparent filled shape
If
backgroundis True then the background of the plot is either or both of:the occupancy grid
the distance field of the planner
Additional arguments
bgargscan be passed through toplot_bg()If
pathis specified it has one column per point and either 2 or 3 rows:2 rows describes motion in the \(xy\)-plane and a 2D plot is created
3 rows describes motion in the \(xy\theta\)-configuration space. By default only the \(xy\)-plane is plotted unless
configspaceis True in which case motion in \(xy\theta\)-configuration space is shown as a 3D plot.
If the planner supports bi-directional motion then the
directionoption gives the direction for each point on the path.Forward motion segments are drawn using style information from
linewhile reverse motion segments are drawn using style information fromline_r. These are each a sequence of dicts of Matplotlib plot options which can draw an arbitrary number of lines on top of each other. The default:line = ( {color:'black', linewidth:4}, {color:'yellow', linewidth:3, dashes:(5,5)} )
will draw a blackline of width 4 with a dashed yellow line of width 3 plotted on top, giving a line of alternating black and yellow dashes.
- Seealso
plot_bg()base.plot_poly()
- property goal
Set/get goal point or configuration (superclass)
- Getter
Return goal pointor configuration
- Return type
ndarray(2) or ndarray(3)
- Setter
Set goal point or configuration
- Param
array_like(2) or array_like(3)
The goal is either a point \((x, y)\) or a configuration \((x, y, \theta)\).
- Seealso
- property occgrid
Occupancy grid
- Returns
occupancy grid used for planning
- Return type
OccGridor subclass or None
Returns the occupancy grid that was optionally inflated at constructor time.
- Seealso
validate_endpoint()isoccupied()
- property start
Set/get start point or configuration (superclass)
- Getter
Return start point or configuration
- Return type
ndarray(2) or ndarray(3)
- Setter
Set start point or configuration
- Param
array_like(2) or array_like(3)
The start is either a point \((x, y)\) or a configuration \((x, y, \theta)\).
- Seealso
- validate_endpoint(p, dtype=None)
Validate start or goal point
- Parameters
p (array_like(2)) – the point
dtype (str, optional) – data type for point coordinates, defaults to None
- Raises
ValueError – point is inside obstacle
- Returns
point as a NumPy array of specified dtype
- Return type
ndarray(2)
The coordinate is tested to be a free cell in the occupancy grid.
- Seealso
isoccupied()occgrid()
- property verbose
Get verbosity
- Returns
verbosity
- Return type
bool
If
verbosityprint more diagnostic messages to the planner’s message channel.
Continuous configuration-space planners
These planners do not support planning around obstacles, but allow for the start and goal configuration \((x, y, \theta)\) to be specified.
Dubins path planner
- class roboticstoolbox.mobile.DubinsPlanner(curvature=1, stepsize=0.1, **kwargs)[source]
Bases:
PlannerBaseDubins path planner
- Parameters
curvature (float, optional) – maximum path curvature, defaults to 1.0
stepsize (float, optional) – spacing between points on the path, defaults to 0.1
- Returns
Dubins path planner
- Return type
DubinsPlanner instance
Feature
Capability
Plan
\(\SE{2}\)
Obstacle avoidance
No
Curvature
Discontinuous
Motion
Forwards only
Creates a planner that finds the path between two configurations in the plane using forward motion only. The path comprises upto 3 segments that are straight lines, or arcs with curvature of \(\pm\)
curvature.Example:
  File "/opt/hostedtoolcache/Python/3.7.15/x64/lib/python3.7/site-packages/roboticstoolbox/mobile/PlannerBase.py", line 326, in validate_endpoint
    p = base.getvector(p, self._ndims, dtype=dtype)
NameError: name 'base' is not defined
Traceback (most recent call last):
  File "<input>", line 1, in <module>
NameError: name 'path' is not defined
Traceback (most recent call last):
  File "<input>", line 1, in <module>
NameError: name 'status' is not defined
- Reference
On Curves of Minimal Length with a Constraint on Average Curvature, and with Prescribed Initial and Terminal Positions and Tangents, Dubins, L.E. (July 1957), American Journal of Mathematics. 79(3): 497–516.
- Thanks
based on Dubins path planning from Python Robotics
- Seealso
- query(start, goal, **kwargs)[source]
Find a path between two configurations
- Parameters
start (array_like(3), optional) – start configuration \((x, y, \theta)\)
goal (array_like(3), optional) – goal configuration \((x, y, \theta)\)
- Returns
path and status
- Return type
ndarray(N,3), namedtuple
The path comprises points equally spaced at a distance of
stepsize.The returned status value has elements:
Element
Description
segmentsa list containing the type of each path segment as a single letter code: either “L”, “R” or “S” for left turn, right turn or straight line respectively.
lengthtotal path length
lengthsthe length of each path segment. The sign of the length indicates the direction of travel.
- property goal
Set/get goal point or configuration (superclass)
- Getter
Return goal pointor configuration
- Return type
ndarray(2) or ndarray(3)
- Setter
Set goal point or configuration
- Param
array_like(2) or array_like(3)
The goal is either a point \((x, y)\) or a configuration \((x, y, \theta)\).
- Seealso
- property occgrid
Occupancy grid
- Returns
occupancy grid used for planning
- Return type
OccGridor subclass or None
Returns the occupancy grid that was optionally inflated at constructor time.
- Seealso
validate_endpoint()isoccupied()
- plan()
Plan path (superclass)
- Parameters
start (array_like(2) or array_like(3), optional) – start position \((x, y)\) or configuration \((x, y, \theta)\), defaults to value passed to constructor
goal (array_like(2) or array_like(3), optional) – goal position \((x, y)\) or configuration \((x, y, \theta)\), defaults to value passed to constructor
The implementation depends on the particular planner. Some may have no planning phase. The plan may also depend on just the start or goal.
- plot(path=None, line=None, line_r=None, configspace=False, unwrap=True, direction=None, background=True, path_marker=None, path_marker_reverse=None, start_marker=None, goal_marker=None, start_vehicle=None, goal_vehicle=None, start=None, goal=None, ax=None, block=False, bgargs={}, **unused)
Plot vehicle path (superclass)
- Parameters
path ((N, 2) or ndarray(N, 3)) – path, defaults to None
direction (array_like(N), optional) – travel direction associated with each point on path, is either >0 or <0, defaults to None
line (sequence of dict of arguments for
plot) – line style for forward motion, default is striped yellow on blackline_r (sequence of dict of arguments for
plot) – line style for reverse motion, default is striped red on blackconfigspace (bool, optional) – plot the path in 3D configuration space, input must be 3xN. Start and goal style will be given by
qstart_markerandqgoal_marker, defaults to Falseunwrap (bool, optional) – for configuration space plot unwrap \(\theta\) so there are no discontinuities at \(\pm \pi\), defaults to True
background (bool, optional) – plot occupancy grid if present, default True
start_marker (dict, optional) – style for marking start point
goal_marker (dict, optional) – style for marking goal point
start_vehicle (dict) – style for vehicle animation object at start configuration
goal_vehicle (dict) – style for vehicle animation object at goal configuration
start (array_like(2) or array_like(3), optional) – start position \((x, y)\) or configuration \((x, y, \theta)\), defaults to value previously set
goal (array_like(2) or array_like(3), optional) – goal position \((x, y)\) or configuration \((x, y, \theta)\), defaults to value previously set
bgargs (dict, optional) – arguments passed to
plot_bg(), defaults to Noneax (matplotlib axes) – axes to plot into
block (bool, optional) – block after displaying the plot
Plots the start and goal location/pose if they are specified by
startorgoalor were set by the object constructor orplanorquerymethod.If the
startandgoalhave length 2, planning in \(\mathbb{R}^2\), then markers are drawn using styles specified bystart_markerandend_markerwhich are dicts using Matplotlib keywords, for example:planner.plot(path, start=dict(marker='s', color='b'))
If the
startandgoalhave length 3, planning in \(\SE{2}\), andconfigspaceis False, then direction-indicating markers are used to display start and goal configuration. These are also given as dicts but have two items:'shape'which is the shape of the polygonal marker and is either'triangle'or'car'. The second item'args'is passed tobase.plot_poly()and Matplotlib and could have values such asfilled=Trueorcolor.If
configspaceis False then a 3D plot is created and the start and goal are indicated by Matplotlib markers specified by the dictsstart_markerandend_markerDefault values are provided for all markers:
the start point is a circle
the goal point is a star
the start vehicle style is a
VehiclePolygon(shape='car')as an unfilled outlinethe goal vehicle style is a
VehiclePolygon(shape='car')as a transparent filled shape
If
backgroundis True then the background of the plot is either or both of:the occupancy grid
the distance field of the planner
Additional arguments
bgargscan be passed through toplot_bg()If
pathis specified it has one column per point and either 2 or 3 rows:2 rows describes motion in the \(xy\)-plane and a 2D plot is created
3 rows describes motion in the \(xy\theta\)-configuration space. By default only the \(xy\)-plane is plotted unless
configspaceis True in which case motion in \(xy\theta\)-configuration space is shown as a 3D plot.
If the planner supports bi-directional motion then the
directionoption gives the direction for each point on the path.Forward motion segments are drawn using style information from
linewhile reverse motion segments are drawn using style information fromline_r. These are each a sequence of dicts of Matplotlib plot options which can draw an arbitrary number of lines on top of each other. The default:line = ( {color:'black', linewidth:4}, {color:'yellow', linewidth:3, dashes:(5,5)} )
will draw a blackline of width 4 with a dashed yellow line of width 3 plotted on top, giving a line of alternating black and yellow dashes.
- Seealso
plot_bg()base.plot_poly()
- property start
Set/get start point or configuration (superclass)
- Getter
Return start point or configuration
- Return type
ndarray(2) or ndarray(3)
- Setter
Set start point or configuration
- Param
array_like(2) or array_like(3)
The start is either a point \((x, y)\) or a configuration \((x, y, \theta)\).
- Seealso
- validate_endpoint(p, dtype=None)
Validate start or goal point
- Parameters
p (array_like(2)) – the point
dtype (str, optional) – data type for point coordinates, defaults to None
- Raises
ValueError – point is inside obstacle
- Returns
point as a NumPy array of specified dtype
- Return type
ndarray(2)
The coordinate is tested to be a free cell in the occupancy grid.
- Seealso
isoccupied()occgrid()
- property verbose
Get verbosity
- Returns
verbosity
- Return type
bool
If
verbosityprint more diagnostic messages to the planner’s message channel.
Reeds-Shepp path planner
- class roboticstoolbox.mobile.ReedsSheppPlanner(curvature=1, stepsize=0.1, **kwargs)[source]
Bases:
PlannerBaseReeds-Shepp path planner
- Parameters
curvature (float, optional) – maximum path curvature, defaults to 1.0
stepsize (float, optional) – spacing between points on the path, defaults to 0.1
Planner (ReedsSheppPlanner instance) – Reeds-Shepp path planner
Feature
Capability
Plan
\(\SE{2}\)
Obstacle avoidance
No
Curvature
Discontinuous
Motion
Bidirectional
Creates a planner that finds the path between two configurations in the plane using forward and backward motion. The path comprises upto 3 segments that are straight lines, or arcs with curvature of \(\pm\)
curvature.Example:
  File "/opt/hostedtoolcache/Python/3.7.15/x64/lib/python3.7/site-packages/roboticstoolbox/mobile/PlannerBase.py", line 326, in validate_endpoint
    p = base.getvector(p, self._ndims, dtype=dtype)
NameError: name 'base' is not defined
Traceback (most recent call last):
  File "<input>", line 1, in <module>
NameError: name 'path' is not defined
Traceback (most recent call last):
  File "<input>", line 1, in <module>
NameError: name 'status' is not defined
- Reference
Optimal paths for a car that goes both forwards and backwards, Reeds, J.A. and L.A. Shepp, Pacific J. Math., 145 (1990), pp. 367–393.
- Thanks
based on Reeds-Shepp path planning from Python Robotics
- Seealso
- query(start, goal, **kwargs)[source]
Find a path between two configurations
- Parameters
start (array_like(3), optional) – start configuration \((x, y, \theta)\)
goal (array_like(3), optional) – goal configuration \((x, y, \theta)\)
- Returns
path and status
- Return type
ndarray(N,3), namedtuple
The path comprises points equally spaced at a distance of
stepsize.The returned status value has elements:
Element
Description
segmentsa list containing the type of each path segment as a single letter code: either “L”, “R” or “S” for left turn, right turn or straight line respectively.
lengthtotal path length
lengthsthe length of each path segment. The sign of the length indicates the direction of travel.
directionthe direction of motion at each point on the path
Note
The direction of turning is reversed when travelling backwards.
- property goal
Set/get goal point or configuration (superclass)
- Getter
Return goal pointor configuration
- Return type
ndarray(2) or ndarray(3)
- Setter
Set goal point or configuration
- Param
array_like(2) or array_like(3)
The goal is either a point \((x, y)\) or a configuration \((x, y, \theta)\).
- Seealso
- property occgrid
Occupancy grid
- Returns
occupancy grid used for planning
- Return type
OccGridor subclass or None
Returns the occupancy grid that was optionally inflated at constructor time.
- Seealso
validate_endpoint()isoccupied()
- plan()
Plan path (superclass)
- Parameters
start (array_like(2) or array_like(3), optional) – start position \((x, y)\) or configuration \((x, y, \theta)\), defaults to value passed to constructor
goal (array_like(2) or array_like(3), optional) – goal position \((x, y)\) or configuration \((x, y, \theta)\), defaults to value passed to constructor
The implementation depends on the particular planner. Some may have no planning phase. The plan may also depend on just the start or goal.
- plot(path=None, line=None, line_r=None, configspace=False, unwrap=True, direction=None, background=True, path_marker=None, path_marker_reverse=None, start_marker=None, goal_marker=None, start_vehicle=None, goal_vehicle=None, start=None, goal=None, ax=None, block=False, bgargs={}, **unused)
Plot vehicle path (superclass)
- Parameters
path ((N, 2) or ndarray(N, 3)) – path, defaults to None
direction (array_like(N), optional) – travel direction associated with each point on path, is either >0 or <0, defaults to None
line (sequence of dict of arguments for
plot) – line style for forward motion, default is striped yellow on blackline_r (sequence of dict of arguments for
plot) – line style for reverse motion, default is striped red on blackconfigspace (bool, optional) – plot the path in 3D configuration space, input must be 3xN. Start and goal style will be given by
qstart_markerandqgoal_marker, defaults to Falseunwrap (bool, optional) – for configuration space plot unwrap \(\theta\) so there are no discontinuities at \(\pm \pi\), defaults to True
background (bool, optional) – plot occupancy grid if present, default True
start_marker (dict, optional) – style for marking start point
goal_marker (dict, optional) – style for marking goal point
start_vehicle (dict) – style for vehicle animation object at start configuration
goal_vehicle (dict) – style for vehicle animation object at goal configuration
start (array_like(2) or array_like(3), optional) – start position \((x, y)\) or configuration \((x, y, \theta)\), defaults to value previously set
goal (array_like(2) or array_like(3), optional) – goal position \((x, y)\) or configuration \((x, y, \theta)\), defaults to value previously set
bgargs (dict, optional) – arguments passed to
plot_bg(), defaults to Noneax (matplotlib axes) – axes to plot into
block (bool, optional) – block after displaying the plot
Plots the start and goal location/pose if they are specified by
startorgoalor were set by the object constructor orplanorquerymethod.If the
startandgoalhave length 2, planning in \(\mathbb{R}^2\), then markers are drawn using styles specified bystart_markerandend_markerwhich are dicts using Matplotlib keywords, for example:planner.plot(path, start=dict(marker='s', color='b'))
If the
startandgoalhave length 3, planning in \(\SE{2}\), andconfigspaceis False, then direction-indicating markers are used to display start and goal configuration. These are also given as dicts but have two items:'shape'which is the shape of the polygonal marker and is either'triangle'or'car'. The second item'args'is passed tobase.plot_poly()and Matplotlib and could have values such asfilled=Trueorcolor.If
configspaceis False then a 3D plot is created and the start and goal are indicated by Matplotlib markers specified by the dictsstart_markerandend_markerDefault values are provided for all markers:
the start point is a circle
the goal point is a star
the start vehicle style is a
VehiclePolygon(shape='car')as an unfilled outlinethe goal vehicle style is a
VehiclePolygon(shape='car')as a transparent filled shape
If
backgroundis True then the background of the plot is either or both of:the occupancy grid
the distance field of the planner
Additional arguments
bgargscan be passed through toplot_bg()If
pathis specified it has one column per point and either 2 or 3 rows:2 rows describes motion in the \(xy\)-plane and a 2D plot is created
3 rows describes motion in the \(xy\theta\)-configuration space. By default only the \(xy\)-plane is plotted unless
configspaceis True in which case motion in \(xy\theta\)-configuration space is shown as a 3D plot.
If the planner supports bi-directional motion then the
directionoption gives the direction for each point on the path.Forward motion segments are drawn using style information from
linewhile reverse motion segments are drawn using style information fromline_r. These are each a sequence of dicts of Matplotlib plot options which can draw an arbitrary number of lines on top of each other. The default:line = ( {color:'black', linewidth:4}, {color:'yellow', linewidth:3, dashes:(5,5)} )
will draw a blackline of width 4 with a dashed yellow line of width 3 plotted on top, giving a line of alternating black and yellow dashes.
- Seealso
plot_bg()base.plot_poly()
- property start
Set/get start point or configuration (superclass)
- Getter
Return start point or configuration
- Return type
ndarray(2) or ndarray(3)
- Setter
Set start point or configuration
- Param
array_like(2) or array_like(3)
The start is either a point \((x, y)\) or a configuration \((x, y, \theta)\).
- Seealso
- validate_endpoint(p, dtype=None)
Validate start or goal point
- Parameters
p (array_like(2)) – the point
dtype (str, optional) – data type for point coordinates, defaults to None
- Raises
ValueError – point is inside obstacle
- Returns
point as a NumPy array of specified dtype
- Return type
ndarray(2)
The coordinate is tested to be a free cell in the occupancy grid.
- Seealso
isoccupied()occgrid()
- property verbose
Get verbosity
- Returns
verbosity
- Return type
bool
If
verbosityprint more diagnostic messages to the planner’s message channel.
Curvature-polynomial planner
- class roboticstoolbox.mobile.CurvaturePolyPlanner(curvature=None)[source]
Bases:
PlannerBase- query(start, goal)[source]
Find a path betwee two configurations
- Parameters
start (array_like(3), optional) – start configuration \((x, y, \theta)\)
goal (array_like(3), optional) – goal configuration \((x, y, \theta)\)
- Returns
path and status
- Return type
ndarray(N,3), namedtuple
The path comprises points equally spaced at a distance of
stepsize.The returned status value has elements:
Element
Description
lengthtotal path length
maxcurvaturemaximum curvature on path
polycurvature polynomial coefficients
- property goal
Set/get goal point or configuration (superclass)
- Getter
Return goal pointor configuration
- Return type
ndarray(2) or ndarray(3)
- Setter
Set goal point or configuration
- Param
array_like(2) or array_like(3)
The goal is either a point \((x, y)\) or a configuration \((x, y, \theta)\).
- Seealso
- property occgrid
Occupancy grid
- Returns
occupancy grid used for planning
- Return type
OccGridor subclass or None
Returns the occupancy grid that was optionally inflated at constructor time.
- Seealso
validate_endpoint()isoccupied()
- plan()
Plan path (superclass)
- Parameters
start (array_like(2) or array_like(3), optional) – start position \((x, y)\) or configuration \((x, y, \theta)\), defaults to value passed to constructor
goal (array_like(2) or array_like(3), optional) – goal position \((x, y)\) or configuration \((x, y, \theta)\), defaults to value passed to constructor
The implementation depends on the particular planner. Some may have no planning phase. The plan may also depend on just the start or goal.
- plot(path=None, line=None, line_r=None, configspace=False, unwrap=True, direction=None, background=True, path_marker=None, path_marker_reverse=None, start_marker=None, goal_marker=None, start_vehicle=None, goal_vehicle=None, start=None, goal=None, ax=None, block=False, bgargs={}, **unused)
Plot vehicle path (superclass)
- Parameters
path ((N, 2) or ndarray(N, 3)) – path, defaults to None
direction (array_like(N), optional) – travel direction associated with each point on path, is either >0 or <0, defaults to None
line (sequence of dict of arguments for
plot) – line style for forward motion, default is striped yellow on blackline_r (sequence of dict of arguments for
plot) – line style for reverse motion, default is striped red on blackconfigspace (bool, optional) – plot the path in 3D configuration space, input must be 3xN. Start and goal style will be given by
qstart_markerandqgoal_marker, defaults to Falseunwrap (bool, optional) – for configuration space plot unwrap \(\theta\) so there are no discontinuities at \(\pm \pi\), defaults to True
background (bool, optional) – plot occupancy grid if present, default True
start_marker (dict, optional) – style for marking start point
goal_marker (dict, optional) – style for marking goal point
start_vehicle (dict) – style for vehicle animation object at start configuration
goal_vehicle (dict) – style for vehicle animation object at goal configuration
start (array_like(2) or array_like(3), optional) – start position \((x, y)\) or configuration \((x, y, \theta)\), defaults to value previously set
goal (array_like(2) or array_like(3), optional) – goal position \((x, y)\) or configuration \((x, y, \theta)\), defaults to value previously set
bgargs (dict, optional) – arguments passed to
plot_bg(), defaults to Noneax (matplotlib axes) – axes to plot into
block (bool, optional) – block after displaying the plot
Plots the start and goal location/pose if they are specified by
startorgoalor were set by the object constructor orplanorquerymethod.If the
startandgoalhave length 2, planning in \(\mathbb{R}^2\), then markers are drawn using styles specified bystart_markerandend_markerwhich are dicts using Matplotlib keywords, for example:planner.plot(path, start=dict(marker='s', color='b'))
If the
startandgoalhave length 3, planning in \(\SE{2}\), andconfigspaceis False, then direction-indicating markers are used to display start and goal configuration. These are also given as dicts but have two items:'shape'which is the shape of the polygonal marker and is either'triangle'or'car'. The second item'args'is passed tobase.plot_poly()and Matplotlib and could have values such asfilled=Trueorcolor.If
configspaceis False then a 3D plot is created and the start and goal are indicated by Matplotlib markers specified by the dictsstart_markerandend_markerDefault values are provided for all markers:
the start point is a circle
the goal point is a star
the start vehicle style is a
VehiclePolygon(shape='car')as an unfilled outlinethe goal vehicle style is a
VehiclePolygon(shape='car')as a transparent filled shape
If
backgroundis True then the background of the plot is either or both of:the occupancy grid
the distance field of the planner
Additional arguments
bgargscan be passed through toplot_bg()If
pathis specified it has one column per point and either 2 or 3 rows:2 rows describes motion in the \(xy\)-plane and a 2D plot is created
3 rows describes motion in the \(xy\theta\)-configuration space. By default only the \(xy\)-plane is plotted unless
configspaceis True in which case motion in \(xy\theta\)-configuration space is shown as a 3D plot.
If the planner supports bi-directional motion then the
directionoption gives the direction for each point on the path.Forward motion segments are drawn using style information from
linewhile reverse motion segments are drawn using style information fromline_r. These are each a sequence of dicts of Matplotlib plot options which can draw an arbitrary number of lines on top of each other. The default:line = ( {color:'black', linewidth:4}, {color:'yellow', linewidth:3, dashes:(5,5)} )
will draw a blackline of width 4 with a dashed yellow line of width 3 plotted on top, giving a line of alternating black and yellow dashes.
- Seealso
plot_bg()base.plot_poly()
- property start
Set/get start point or configuration (superclass)
- Getter
Return start point or configuration
- Return type
ndarray(2) or ndarray(3)
- Setter
Set start point or configuration
- Param
array_like(2) or array_like(3)
The start is either a point \((x, y)\) or a configuration \((x, y, \theta)\).
- Seealso
- validate_endpoint(p, dtype=None)
Validate start or goal point
- Parameters
p (array_like(2)) – the point
dtype (str, optional) – data type for point coordinates, defaults to None
- Raises
ValueError – point is inside obstacle
- Returns
point as a NumPy array of specified dtype
- Return type
ndarray(2)
The coordinate is tested to be a free cell in the occupancy grid.
- Seealso
isoccupied()occgrid()
- property verbose
Get verbosity
- Returns
verbosity
- Return type
bool
If
verbosityprint more diagnostic messages to the planner’s message channel.
Quintic-polynomial planner
- class roboticstoolbox.mobile.QuinticPolyPlanner(dt=0.1, start_vel=0, start_acc=0, goal_vel=0, goal_acc=0, max_acc=1, max_jerk=0.5, min_t=5, max_t=100)[source]
Bases:
PlannerBaseQuintic polynomial path planner
- Parameters
dt (float, optional) – time step, defaults to 0.1
start_vel (float, optional) – initial velocity, defaults to 0
start_acc (float, optional) – initial acceleration, defaults to 0
goal_vel (float, optional) – goal velocity, defaults to 0
goal_acc (float, optional) – goal acceleration, defaults to 0
max_acc (int, optional) – [description], defaults to 1
max_jerk (float, optional) – maximum jerk, defaults to 0.5
min_t (float, optional) – minimum path time, defaults to 5
max_t (float, optional) – maximum path time, defaults to 100
- Returns
Quintic polynomial path planner
- Return type
QuinticPolyPlanner instance
Feature
Capability
Plan
\(\SE{2}\)
Obstacle avoidance
No
Curvature
Continuous
Motion
Forwards only
Creates a planner that finds the path between two configurations in the plane using forward motion only. The path is a continuous quintic polynomial for x and y
\[\begin{split}x(t) &= a_0 + a_1 t + a_2 t^2 + a_3 t^3 + a_4 t^4 + a_5 t^5 \\ y(t) &= b_0 + b_1 t + b_2 t^2 + b_3 t^3 + b_4 t^4 + b_5 t^5\end{split}\]- Reference
“Local Path Planning And Motion Control For AGV In Positioning”, Takahashi, T. Hongo, Y. Ninomiya and G. Sugimoto; Proceedings. IEEE/RSJ International Workshop on Intelligent Robots and Systems (IROS ‘89) doi: 10.1109/IROS.1989.637936
Note
The path time is searched in the interval [
min_t,max_t] in steps ofmin_t.Example:
>>> from roboticstoolbox import QuinticPolyPlanner
>>> import numpy as np
>>> start = (10, 10, np.deg2rad(10.0))
>>> goal = (30, -10, np.deg2rad(20.0))
>>> quintic = QuinticPolyPlanner(start_vel=1)
>>> path, status = quintic.query(start, goal)
find path!!
>>> print(path[:5,:])
[[10.     10.      0.1745]
 [10.0985 10.0173  0.1724]
 [10.1971 10.0342  0.1662]
 [10.2959 10.0503  0.156 ]
 [10.3949 10.0652  0.142 ]]
- Thanks
based on quintic polynomial planning from Python Robotics
- Seealso
Planner
- query(start, goal)[source]
Find a quintic polynomial path
- Parameters
start (array_like(3), optional) – start configuration \((x, y, \theta)\)
goal (array_like(3), optional) – goal configuration \((x, y, \theta)\)
- Returns
path and status
- Return type
ndarray(N,3), namedtuple
The returned status value has elements:
Element
Description
ttime to execute the path
velvelocity profile along the path
accelacceleration profile along the path
jerkjerk profile along the path
- Seealso
Planner.query()
- property goal
Set/get goal point or configuration (superclass)
- Getter
Return goal pointor configuration
- Return type
ndarray(2) or ndarray(3)
- Setter
Set goal point or configuration
- Param
array_like(2) or array_like(3)
The goal is either a point \((x, y)\) or a configuration \((x, y, \theta)\).
- Seealso
- property occgrid
Occupancy grid
- Returns
occupancy grid used for planning
- Return type
OccGridor subclass or None
Returns the occupancy grid that was optionally inflated at constructor time.
- Seealso
validate_endpoint()isoccupied()
- plan()
Plan path (superclass)
- Parameters
start (array_like(2) or array_like(3), optional) – start position \((x, y)\) or configuration \((x, y, \theta)\), defaults to value passed to constructor
goal (array_like(2) or array_like(3), optional) – goal position \((x, y)\) or configuration \((x, y, \theta)\), defaults to value passed to constructor
The implementation depends on the particular planner. Some may have no planning phase. The plan may also depend on just the start or goal.
- plot(path=None, line=None, line_r=None, configspace=False, unwrap=True, direction=None, background=True, path_marker=None, path_marker_reverse=None, start_marker=None, goal_marker=None, start_vehicle=None, goal_vehicle=None, start=None, goal=None, ax=None, block=False, bgargs={}, **unused)
Plot vehicle path (superclass)
- Parameters
path ((N, 2) or ndarray(N, 3)) – path, defaults to None
direction (array_like(N), optional) – travel direction associated with each point on path, is either >0 or <0, defaults to None
line (sequence of dict of arguments for
plot) – line style for forward motion, default is striped yellow on blackline_r (sequence of dict of arguments for
plot) – line style for reverse motion, default is striped red on blackconfigspace (bool, optional) – plot the path in 3D configuration space, input must be 3xN. Start and goal style will be given by
qstart_markerandqgoal_marker, defaults to Falseunwrap (bool, optional) – for configuration space plot unwrap \(\theta\) so there are no discontinuities at \(\pm \pi\), defaults to True
background (bool, optional) – plot occupancy grid if present, default True
start_marker (dict, optional) – style for marking start point
goal_marker (dict, optional) – style for marking goal point
start_vehicle (dict) – style for vehicle animation object at start configuration
goal_vehicle (dict) – style for vehicle animation object at goal configuration
start (array_like(2) or array_like(3), optional) – start position \((x, y)\) or configuration \((x, y, \theta)\), defaults to value previously set
goal (array_like(2) or array_like(3), optional) – goal position \((x, y)\) or configuration \((x, y, \theta)\), defaults to value previously set
bgargs (dict, optional) – arguments passed to
plot_bg(), defaults to Noneax (matplotlib axes) – axes to plot into
block (bool, optional) – block after displaying the plot
Plots the start and goal location/pose if they are specified by
startorgoalor were set by the object constructor orplanorquerymethod.If the
startandgoalhave length 2, planning in \(\mathbb{R}^2\), then markers are drawn using styles specified bystart_markerandend_markerwhich are dicts using Matplotlib keywords, for example:planner.plot(path, start=dict(marker='s', color='b'))
If the
startandgoalhave length 3, planning in \(\SE{2}\), andconfigspaceis False, then direction-indicating markers are used to display start and goal configuration. These are also given as dicts but have two items:'shape'which is the shape of the polygonal marker and is either'triangle'or'car'. The second item'args'is passed tobase.plot_poly()and Matplotlib and could have values such asfilled=Trueorcolor.If
configspaceis False then a 3D plot is created and the start and goal are indicated by Matplotlib markers specified by the dictsstart_markerandend_markerDefault values are provided for all markers:
the start point is a circle
the goal point is a star
the start vehicle style is a
VehiclePolygon(shape='car')as an unfilled outlinethe goal vehicle style is a
VehiclePolygon(shape='car')as a transparent filled shape
If
backgroundis True then the background of the plot is either or both of:the occupancy grid
the distance field of the planner
Additional arguments
bgargscan be passed through toplot_bg()If
pathis specified it has one column per point and either 2 or 3 rows:2 rows describes motion in the \(xy\)-plane and a 2D plot is created
3 rows describes motion in the \(xy\theta\)-configuration space. By default only the \(xy\)-plane is plotted unless
configspaceis True in which case motion in \(xy\theta\)-configuration space is shown as a 3D plot.
If the planner supports bi-directional motion then the
directionoption gives the direction for each point on the path.Forward motion segments are drawn using style information from
linewhile reverse motion segments are drawn using style information fromline_r. These are each a sequence of dicts of Matplotlib plot options which can draw an arbitrary number of lines on top of each other. The default:line = ( {color:'black', linewidth:4}, {color:'yellow', linewidth:3, dashes:(5,5)} )
will draw a blackline of width 4 with a dashed yellow line of width 3 plotted on top, giving a line of alternating black and yellow dashes.
- Seealso
plot_bg()base.plot_poly()
- property start
Set/get start point or configuration (superclass)
- Getter
Return start point or configuration
- Return type
ndarray(2) or ndarray(3)
- Setter
Set start point or configuration
- Param
array_like(2) or array_like(3)
The start is either a point \((x, y)\) or a configuration \((x, y, \theta)\).
- Seealso
- validate_endpoint(p, dtype=None)
Validate start or goal point
- Parameters
p (array_like(2)) – the point
dtype (str, optional) – data type for point coordinates, defaults to None
- Raises
ValueError – point is inside obstacle
- Returns
point as a NumPy array of specified dtype
- Return type
ndarray(2)
The coordinate is tested to be a free cell in the occupancy grid.
- Seealso
isoccupied()occgrid()
- property verbose
Get verbosity
- Returns
verbosity
- Return type
bool
If
verbosityprint more diagnostic messages to the planner’s message channel.
RRT planner
- class roboticstoolbox.mobile.RRTPlanner(map, vehicle, curvature=1.0, stepsize=0.2, showsamples=False, npoints=50, **kwargs)[source]
Bases:
PlannerBaseRapidly exploring tree planner
- Parameters
map (
PolygonMap) – occupancy gridvehicle (
VehicleBasesubclass) – vehicle kinematic modelcurvature (float, optional) – maximum path curvature, defaults to 1.0
stepsize (float, optional) – spacing between points on the path, defaults to 0.2
showsamples (bool, optional) – shows vehicle polygons for all random samples, defaults to False
npoints (int, optional) – number of vertices in random tree, defaults to 50
Feature
Capability
Plan
\(\SE{2}\)
Obstacle avoidance
Yes, polygons
Curvature
Discontinuous
Motion
Bidirectional
Creates a planner that finds the obstacle-free path between two configurations in the plane using forward and backward motion. The path comprises multiple Dubins curves comprising straight lines, or arcs with curvature of \(\pm\)
curvature. Motion along the segments may be in the forward or backward direction.Polygons are used for obstacle avoidance:
the environment is defined by a set of polygons represented by a
PolygonMapthe vehicle is defined by a single polygon specified by the
polygonargument to its constructor
Example:
from roboticstoolbox import RRTPlanner
from spatialmath import Polygon2
from math import pi

# create polygonal obstacles
map = PolygonMap(workspace=[0, 10])
map.add([(5, 50), (5, 6), (6, 6), (6, 50)])
map.add([(5, 4), (5, -50), (6, -50), (6, 4)])

# create outline polygon for vehicle
l, w = 3, 1.5
vpolygon = Polygon2([(-l/2, w/2), (-l/2, -w/2), (l/2, -w/2), (l/2, w/2)])

# create vehicle model
vehicle = Bicycle(steer_max=1, L=2, polygon=vpolygon)

# create planner
rrt = RRTPlanner(map=map, vehicle=vehicle, npoints=50, seed=0)
# start and goal configuration
qs = (2, 8, -pi/2)
qg = (8, 2, -pi/2)

# plan path
rrt.plan(goal=qg)
path, status = rrt.query(start=qs)
print(path[:5,:])
print(status)
- Seealso
- plan(goal, animate=True, search_until_npoints=True)[source]
Plan paths to goal using RRT
- Parameters
goal (array_like(3), optional) – goal pose \((x, y, \theta)\), defaults to previously set value
Compute a rapidly exploring random tree with its root at the
goal. The tree will havenpointsvertices spread uniformly randomly over the workspace which is an attribute of themap.For every new point added, a Dubins path is computed to the nearest vertex already in the graph. Each configuration on that path, with spacing of
stepsize, is tested for obstacle intersection.- Seealso
- query(start)[source]
Find a path from start configuration
- Parameters
start (array_like(3), optional) – start configuration \((x, y, \theta)\)
- Returns
path and status
- Return type
ndarray(N,3), namedtuple
The path comprises points equally spaced at a distance of
stepsize.The returned status value has elements:
Element
Description
length| total path lengthinitial_d| distance from start to first vertex in graphverticessequence of vertices in the graph
- qrandom()[source]
Random configuration
- Returns
random configuration \((x, y, \theta)\)
- Return type
ndarray(3)
Returns a random configuration where position \((x, y)\) lies within the bounds of the
mapassociated with this planner.- Seealso
- qrandom_free()[source]
Random obstacle free configuration
- Returns
random configuration \((x, y, \theta)\)
- Return type
ndarray(3)
Returns a random obstacle free configuration where position \((x, y)\) lies within the bounds of the
mapassociated with this planner. Iterates onqrandom()- Seealso
- iscollision(q)[source]
Test if configuration is collision
- Parameters
q (array_like(3)) – vehicle configuration \((x, y, \theta)\)
- Returns
collision status
- Return type
bool
Transforms the vehicle polygon and tests for intersection against the polygonal obstacle map.
- property goal
Set/get goal point or configuration (superclass)
- Getter
Return goal pointor configuration
- Return type
ndarray(2) or ndarray(3)
- Setter
Set goal point or configuration
- Param
array_like(2) or array_like(3)
The goal is either a point \((x, y)\) or a configuration \((x, y, \theta)\).
- Seealso
- property occgrid
Occupancy grid
- Returns
occupancy grid used for planning
- Return type
OccGridor subclass or None
Returns the occupancy grid that was optionally inflated at constructor time.
- Seealso
validate_endpoint()isoccupied()
- plot(path=None, line=None, line_r=None, configspace=False, unwrap=True, direction=None, background=True, path_marker=None, path_marker_reverse=None, start_marker=None, goal_marker=None, start_vehicle=None, goal_vehicle=None, start=None, goal=None, ax=None, block=False, bgargs={}, **unused)
Plot vehicle path (superclass)
- Parameters
path ((N, 2) or ndarray(N, 3)) – path, defaults to None
direction (array_like(N), optional) – travel direction associated with each point on path, is either >0 or <0, defaults to None
line (sequence of dict of arguments for
plot) – line style for forward motion, default is striped yellow on blackline_r (sequence of dict of arguments for
plot) – line style for reverse motion, default is striped red on blackconfigspace (bool, optional) – plot the path in 3D configuration space, input must be 3xN. Start and goal style will be given by
qstart_markerandqgoal_marker, defaults to Falseunwrap (bool, optional) – for configuration space plot unwrap \(\theta\) so there are no discontinuities at \(\pm \pi\), defaults to True
background (bool, optional) – plot occupancy grid if present, default True
start_marker (dict, optional) – style for marking start point
goal_marker (dict, optional) – style for marking goal point
start_vehicle (dict) – style for vehicle animation object at start configuration
goal_vehicle (dict) – style for vehicle animation object at goal configuration
start (array_like(2) or array_like(3), optional) – start position \((x, y)\) or configuration \((x, y, \theta)\), defaults to value previously set
goal (array_like(2) or array_like(3), optional) – goal position \((x, y)\) or configuration \((x, y, \theta)\), defaults to value previously set
bgargs (dict, optional) – arguments passed to
plot_bg(), defaults to Noneax (matplotlib axes) – axes to plot into
block (bool, optional) – block after displaying the plot
Plots the start and goal location/pose if they are specified by
startorgoalor were set by the object constructor orplanorquerymethod.If the
startandgoalhave length 2, planning in \(\mathbb{R}^2\), then markers are drawn using styles specified bystart_markerandend_markerwhich are dicts using Matplotlib keywords, for example:planner.plot(path, start=dict(marker='s', color='b'))
If the
startandgoalhave length 3, planning in \(\SE{2}\), andconfigspaceis False, then direction-indicating markers are used to display start and goal configuration. These are also given as dicts but have two items:'shape'which is the shape of the polygonal marker and is either'triangle'or'car'. The second item'args'is passed tobase.plot_poly()and Matplotlib and could have values such asfilled=Trueorcolor.If
configspaceis False then a 3D plot is created and the start and goal are indicated by Matplotlib markers specified by the dictsstart_markerandend_markerDefault values are provided for all markers:
the start point is a circle
the goal point is a star
the start vehicle style is a
VehiclePolygon(shape='car')as an unfilled outlinethe goal vehicle style is a
VehiclePolygon(shape='car')as a transparent filled shape
If
backgroundis True then the background of the plot is either or both of:the occupancy grid
the distance field of the planner
Additional arguments
bgargscan be passed through toplot_bg()If
pathis specified it has one column per point and either 2 or 3 rows:2 rows describes motion in the \(xy\)-plane and a 2D plot is created
3 rows describes motion in the \(xy\theta\)-configuration space. By default only the \(xy\)-plane is plotted unless
configspaceis True in which case motion in \(xy\theta\)-configuration space is shown as a 3D plot.
If the planner supports bi-directional motion then the
directionoption gives the direction for each point on the path.Forward motion segments are drawn using style information from
linewhile reverse motion segments are drawn using style information fromline_r. These are each a sequence of dicts of Matplotlib plot options which can draw an arbitrary number of lines on top of each other. The default:line = ( {color:'black', linewidth:4}, {color:'yellow', linewidth:3, dashes:(5,5)} )
will draw a blackline of width 4 with a dashed yellow line of width 3 plotted on top, giving a line of alternating black and yellow dashes.
- Seealso
plot_bg()base.plot_poly()
- property start
Set/get start point or configuration (superclass)
- Getter
Return start point or configuration
- Return type
ndarray(2) or ndarray(3)
- Setter
Set start point or configuration
- Param
array_like(2) or array_like(3)
The start is either a point \((x, y)\) or a configuration \((x, y, \theta)\).
- Seealso
- validate_endpoint(p, dtype=None)
Validate start or goal point
- Parameters
p (array_like(2)) – the point
dtype (str, optional) – data type for point coordinates, defaults to None
- Raises
ValueError – point is inside obstacle
- Returns
point as a NumPy array of specified dtype
- Return type
ndarray(2)
The coordinate is tested to be a free cell in the occupancy grid.
- Seealso
isoccupied()occgrid()
- property verbose
Get verbosity
- Returns
verbosity
- Return type
bool
If
verbosityprint more diagnostic messages to the planner’s message channel.
Map classes
Occupancy grid classes
Binary Occupancy grid
- class roboticstoolbox.mobile.BinaryOccupancyGrid(grid=None, **kwargs)[source]
Bases:
BaseOccupancyGrid- __init__(grid=None, **kwargs)[source]
Create a binary occupancy grid instance
- Parameters
grid (ndarray(N,M)) – occupancy grid as a NumPy array
size (float, optional) – cell size, defaults to 1
origin (array_like(2), optional) – world coordinates of the grid element [0,0], defaults to (0, 0)
kwargs – options passed to
BaseMap
The array is kept internally as a bool array. Cells are set to True (occupied) corresponding to input values > 0.
This object supports a user-defined coordinate system and grid size. World coordinates are converted to grid coordinates to lookup the occupancy status.
Example:
>>> from roboticstoolbox import BinaryOccupancyGrid
>>> import numpy as np
>>> og = BinaryOccupancyGrid(np.zeros((5,5)))
>>> print(og)
BinaryOccupancyGrid: 5 x 5, cell size=1, x = [0.0, 4.0], y = [0.0, 4.0], 0.0% occupied
>>> og = BinaryOccupancyGrid(workspace=[-5,5], cellsize=0.1, value=0)
>>> print(og)
BinaryOccupancyGrid: 101 x 101, cell size=0.1, x = [-5.0, 5.0], y = [-5.0, 5.0], 0.0% occupied
- Seealso
- isoccupied(p)[source]
Test if coordinate is occupied
- Parameters
p (array_like(2)) – world coordinate (x, y)
- Returns
occupancy status of corresponding grid cell
- Return type
bool
The grid cell size and offset are used to convert
pto an occupancy grid coordinate. The grid coordinate is rounded and cast to integer value. If the coordinate is outside the bounds of the occupancy grid it is considered to be occupied.- Seealso
- inflate(radius)[source]
Inflate obstales
- Parameters
radius (float) – radius of circular structuring element in world units
A circular structuring element is created and used to dilate the stored occupancy grid.
Successive calls to
inflatewill compound the inflation.- Seealso
- copy()
Copy an occupancy grid (superclass)
- Returns
copy of the ocupancy grid
- Return type
OccGrid
- g2w(p)
Convert grid coordinate to world coordinate (superclass)
- Parameters
p (array_like(2)) – grid coordinate (column, row)
- Returns
world coordinate (x, y)
- Return type
ndarray(2)
The grid cell size and offset are used to convert occupancy grid coordinate
pto a world coordinate.
- property grid
Occupancy grid as a NumPy array (superclass)
- Returns
binary occupancy grid
- Return type
ndarray(N,M) of bool
If
inflate()has been called, this will return the inflated occupancy grid.
- line_w(p1, p2)
Get index of cells along a line segment (superclass)
- Parameters
p1 (array_like(2)) – start
p2 (array_like(2)) – end
- Returns
index into grid
- Return type
ndarray(N)
Get the indices of cells along a line segment defined by the end points given in world coordinates.
The returned indices can be applied to a raveled view of the grid.
- property maxdim
Maximum dimension of grid in world coordinates (superclass)
- Returns
maximum side length of the occupancy grid
- Return type
float
- property name
Occupancy grid name (superclass)
- Returns
name of the occupancy grid
- Return type
str
- plot(map=None, ax=None, block=False, **kwargs)
Plot the occupancy grid (superclass)
- Parameters
map (ndarray(N,M), optional) – array which is plotted instead of the grid, must be same size as the occupancy grid,defaults to None
ax (Axes2D, optional) – matplotlib axes to plot into, defaults to None
block (bool, optional) – block until plot is dismissed, defaults to False
kwargs – arguments passed to
imshow
The grid is plotted as an image but with axes in world coordinates.
The grid is a NumPy boolean array which has values 0 (false=unoccupied) and 1 (true=occupied). Passing a cmap option to imshow can be used to control the displayed color of free space and obstacles.
- property ravel
Ravel the grid (superclass)
- Returns
1D view of the occupancy grid
- Return type
ndarray(N)
- set(region, value)
Set region of map (superclass)
- Parameters
region (array_like(4)) – The region [xmin, ymin, xmax, ymax]
value (int, bool, float) – value to set cells to
- property shape
Shape of the occupancy grid array (superclass)
- Returns
shape of the occupancy grid array
- Return type
2-tuple
This is the shape of the NumPy array that holds the occupancy grid.
- w2g(p)
Convert world coordinate to grid coordinate (superclass)
- Parameters
p (array_like(2)) – world coordinate (x, y)
- Returns
grid coordinate (column, row)
- Return type
ndarray(2)
The grid cell size and offset are used to convert
pto an occupancy grid coordinate. The grid coordinate is rounded and cast to integer value. No check is made on the validity of the coordinate.
- property workspace
Bounds of the occupancy grid in world coordinates (superclass)
- Returns
workspace bounds [xmin, xmax, ymin, ymax]
- Return type
ndarray(4)
Returns the bounds of the occupancy grid in world coordinates.
- property xmax
Maximum x-coordinate of this grid (superclass)
- Returns
maximum world x-coordinate
- Return type
float
- property xmin
Minimum x-coordinate of this grid (superclass)
- Returns
minimum world x-coordinate
- Return type
float
- property ymax
Maximum y-coordinate of this grid (superclass)
- Returns
maximum world y-coordinate
- Return type
float
- property ymin
Minimum y-coordinate of this grid (superclass)
- Returns
minimum world y-coordinate
- Return type
float
Occupancy grid
- class roboticstoolbox.mobile.OccupancyGrid(grid=None, origin=(0, 0), value=0, cellsize=1, **kwargs)[source]
Bases:
BaseOccupancyGridGeneral occupancy grid
The elements of the array are floats and can represent occupancy probability or traversal cost.
Example:
>>> from roboticstoolbox import OccupancyGrid
>>> import numpy as np
>>> og = OccupancyGrid(np.zeros((5,5)))
>>> print(og)
OccupancyGrid: 5 x 5, cell size=1, x = [0.0, 4.0], y = [0.0, 4.0], dtype float64, min 0.0, max 0.0, mean 0.0
>>> og = OccupancyGrid(workspace=[-5,5], cellsize=0.1, value=0.5)
>>> print(og)
OccupancyGrid: 101 x 101, cell size=0.1, x = [-5.0, 5.0], y = [-5.0, 5.0], dtype float64, min 0.5, max 0.5, mean 0.5
- Seealso
- __init__(grid=None, origin=(0, 0), value=0, cellsize=1, **kwargs)
Occupancy grid (superclass)
- Parameters
grid (ndarray(N,M)) – occupancy grid as a NumPy array
value (any, optional) – initial value of cells
origin (array_like(2), optional) – world coordinates of the grid element [0,0], defaults to (0, 0)
cellsize (float, optional) – cell size, defaults to 1
kwargs – options passed to
BaseMap
This object supports a user-defined coordinate system and grid size. World coordinates are converted to grid coordinates to lookup the occupancy status.
The grid can be initialized by:
a 2D NumPy array
specifying
workspaceandvaluearguments
- copy()
Copy an occupancy grid (superclass)
- Returns
copy of the ocupancy grid
- Return type
OccGrid
- g2w(p)
Convert grid coordinate to world coordinate (superclass)
- Parameters
p (array_like(2)) – grid coordinate (column, row)
- Returns
world coordinate (x, y)
- Return type
ndarray(2)
The grid cell size and offset are used to convert occupancy grid coordinate
pto a world coordinate.
- property grid
Occupancy grid as a NumPy array (superclass)
- Returns
binary occupancy grid
- Return type
ndarray(N,M) of bool
If
inflate()has been called, this will return the inflated occupancy grid.
- line_w(p1, p2)
Get index of cells along a line segment (superclass)
- Parameters
p1 (array_like(2)) – start
p2 (array_like(2)) – end
- Returns
index into grid
- Return type
ndarray(N)
Get the indices of cells along a line segment defined by the end points given in world coordinates.
The returned indices can be applied to a raveled view of the grid.
- property maxdim
Maximum dimension of grid in world coordinates (superclass)
- Returns
maximum side length of the occupancy grid
- Return type
float
- property name
Occupancy grid name (superclass)
- Returns
name of the occupancy grid
- Return type
str
- plot(map=None, ax=None, block=False, **kwargs)
Plot the occupancy grid (superclass)
- Parameters
map (ndarray(N,M), optional) – array which is plotted instead of the grid, must be same size as the occupancy grid,defaults to None
ax (Axes2D, optional) – matplotlib axes to plot into, defaults to None
block (bool, optional) – block until plot is dismissed, defaults to False
kwargs – arguments passed to
imshow
The grid is plotted as an image but with axes in world coordinates.
The grid is a NumPy boolean array which has values 0 (false=unoccupied) and 1 (true=occupied). Passing a cmap option to imshow can be used to control the displayed color of free space and obstacles.
- property ravel
Ravel the grid (superclass)
- Returns
1D view of the occupancy grid
- Return type
ndarray(N)
- set(region, value)
Set region of map (superclass)
- Parameters
region (array_like(4)) – The region [xmin, ymin, xmax, ymax]
value (int, bool, float) – value to set cells to
- property shape
Shape of the occupancy grid array (superclass)
- Returns
shape of the occupancy grid array
- Return type
2-tuple
This is the shape of the NumPy array that holds the occupancy grid.
- w2g(p)
Convert world coordinate to grid coordinate (superclass)
- Parameters
p (array_like(2)) – world coordinate (x, y)
- Returns
grid coordinate (column, row)
- Return type
ndarray(2)
The grid cell size and offset are used to convert
pto an occupancy grid coordinate. The grid coordinate is rounded and cast to integer value. No check is made on the validity of the coordinate.
- property workspace
Bounds of the occupancy grid in world coordinates (superclass)
- Returns
workspace bounds [xmin, xmax, ymin, ymax]
- Return type
ndarray(4)
Returns the bounds of the occupancy grid in world coordinates.
- property xmax
Maximum x-coordinate of this grid (superclass)
- Returns
maximum world x-coordinate
- Return type
float
- property xmin
Minimum x-coordinate of this grid (superclass)
- Returns
minimum world x-coordinate
- Return type
float
- property ymax
Maximum y-coordinate of this grid (superclass)
- Returns
maximum world y-coordinate
- Return type
float
- property ymin
Minimum y-coordinate of this grid (superclass)
- Returns
minimum world y-coordinate
- Return type
float
Polygon map
- class roboticstoolbox.mobile.PolygonMap(workspace=None, polygons=[])[source]
Bases:
BaseMap- __init__(workspace=None, polygons=[])[source]
Polygonal obstacle map
- Parameters
workspace (float, array_like(2), array_like(4)) – dimensions of 2D plot area, defaults to (-10:10) x (-10:10), see
plotvol2()polygons (list, optional) – _description_, defaults to []
The workspace can be specified in several ways:
workspacex-range
y-range
A (scalar)
-A:A
-A:A
[A, B]
A:B
A:B
[A, B, C, D]
A:B
C:D
Workspace is used only to set plot bounds.
- add(polygon)[source]
Add a polygon to map
- Parameters
polygon (
Polygon2or ndarray(2,N)) – a polygon
- iscollision(polygon)[source]
Test for collision
- Parameters
polygon (
Polygon2or ndarray(2,N)) – a polygon- Returns
collision
- Return type
bool
The
polygonis tested against polygons in the map, and returns True on the first collision.- Seealso
add()Polygon2
- isoccupied(p)[source]
Test if point lies inside an obstacle
- Parameters
p (array_like(2)) – a 2D point
- Returns
enclosure
- Return type
bool
The point is tested for enclosure by polygons in the map, and returns True on the first enclosure.
- property workspace
Bounds of the occupancy grid
- Returns
workspace bounds [xmin, xmax, ymin, ymax]
- Return type
ndarray(4)
Returns the bounds of the occupancy grid.
Supporting classes
Planner superclass
- class roboticstoolbox.mobile.PlannerBase(occgrid=None, inflate=0, ndims=None, start=None, goal=None, verbose=False, msgcolor='yellow', progress=True, marker=None, seed=None, **unused)[source]
Bases:
ABCMobile robot motion planner (superclass)
- Parameters
occgrid (
OccGridinstance of ndarray(N,M), optional) – occupancy grid, defaults to Nonestart (array_like(2) or array_like(3), optional) – start position \((x, y)\) or configuration \((x, y, \theta)\), defaults to None
goal (array_like(2) or array_like(3), optional) – goal position \((x, y)\) or configuration \((x, y, \theta)\), defaults to None
inflate (float, optional) – obstacle inflation, defaults to 0
ndims – dimensionality of the planning, either 2 for \(\mathbb{R}^2\) or 3 for \(\SE{2}\)
ndims – int, optional
verbose (bool, optional) – verbosity, defaults to False
msgcolor (str, defaults to yellow) – color for message channel printing
seed (int, optional) – seed provided to private random number generator, defaults to None
Superclass for all mobile robot motion planners. Key functionality includes:
encapsulates an occupancy grid and optionally inflates it
validates
startandgoalif givenencapsulates a private random number generator with specifiable seed
encapsulates state such as start, goal, and the plan
provides a message channel for diagnostic output
The start and goal can be specifed in various ways:
at constructor time by the arguments
startorgoalby assigning the attributes
startorgoalat planning time by specifying
goaltoplan()at query time by specifying
starttoquery()
- Seealso
OccGrid
- property start
Set/get start point or configuration (superclass)
- Getter
Return start point or configuration
- Return type
ndarray(2) or ndarray(3)
- Setter
Set start point or configuration
- Param
array_like(2) or array_like(3)
The start is either a point \((x, y)\) or a configuration \((x, y, \theta)\).
- Seealso
- property goal
Set/get goal point or configuration (superclass)
- Getter
Return goal pointor configuration
- Return type
ndarray(2) or ndarray(3)
- Setter
Set goal point or configuration
- Param
array_like(2) or array_like(3)
The goal is either a point \((x, y)\) or a configuration \((x, y, \theta)\).
- Seealso
- property verbose
Get verbosity
- Returns
verbosity
- Return type
bool
If
verbosityprint more diagnostic messages to the planner’s message channel.
- property random
Get private random number generator
- Returns
NumPy random number generator
- Return type
Has methods including:
The generator is initialized with the seed provided at constructor time.
- Seealso
- random_init(seed=None)[source]
Initialize private random number generator
- Parameters
seed (int) – random number seed, defaults to value given to constructor
The private random number generator is initialized. The seed is
seedor the value given to the constructor. If None, the generator will be randomly seeded using a seed from the operating system.
- plan()[source]
Plan path (superclass)
- Parameters
start (array_like(2) or array_like(3), optional) – start position \((x, y)\) or configuration \((x, y, \theta)\), defaults to value passed to constructor
goal (array_like(2) or array_like(3), optional) – goal position \((x, y)\) or configuration \((x, y, \theta)\), defaults to value passed to constructor
The implementation depends on the particular planner. Some may have no planning phase. The plan may also depend on just the start or goal.
- property occgrid
Occupancy grid
- Returns
occupancy grid used for planning
- Return type
OccGridor subclass or None
Returns the occupancy grid that was optionally inflated at constructor time.
- Seealso
- isoccupied(p)[source]
Test if point is occupied (superclass)
- Parameters
p (array_like(2)) – world coordinate (x, y)
- Returns
occupancy status of corresponding grid cell
- Return type
bool
The world coordinate is transformed and the status of the occupancy grid cell is returned. If the point lies outside the bounds of the occupancy grid return True (obstacle)
If there is no occupancy grid this function always returns False (free).
- Seealso
occgrid()validate_endpoint()BinaryOccGrid.isoccupied()
- validate_endpoint(p, dtype=None)[source]
Validate start or goal point
- Parameters
p (array_like(2)) – the point
dtype (str, optional) – data type for point coordinates, defaults to None
- Raises
ValueError – point is inside obstacle
- Returns
point as a NumPy array of specified dtype
- Return type
ndarray(2)
The coordinate is tested to be a free cell in the occupancy grid.
- Seealso
- progress_start(n)[source]
Initialize a progress bar (superclass)
- Parameters
n (int) – Number of iterations in the operation
Create a progress bar for an operation that has
nsteps, for example:planner.progress_start(100) for i in range(100): # ... planner.progress_next() planner.progress_end()
- Seealso
- progress_next()[source]
Increment a progress bar (superclass)
Create a progress bar for an operation that has
nsteps, for example:planner.progress_start(100) for i in range(100): # ... planner.progress_next() planner.progress_end()
- Seealso
- progress_end()[source]
Finalize a progress bar (superclass)
Remove/cleanip a progress bar, for example:
planner.progress_start(100)
for i in range(100):
    # ...
    planner.progress_next()
planner.progress_end()
- Seealso
- query(start=None, goal=None, dtype=None, next=True, animate=False, movie=None)[source]
Find a path from start to goal using planner (superclass)
- Parameters
start (array_like(), optional) – start position \((x, y)\) or configuration \((x, y, \theta)\), defaults to value specified to constructor
goal (array_like(), optional) – goal position \((x, y)\) or configuration \((x, y, \theta)\), defaults to value specified to constructor
dtype (str, optional) – data type for point coordinates, defaults to None
next (bool, optional) – invoke
next()method of class, defaults to Trueanimate (bool, optional) – show the vehicle path, defaults to False
- Returns
path from start to goal, one point \((x, y)\) or configuration \((x, y, \theta)\) per row
- Return type
ndarray(N,2) or ndarray(N,3)
Find a path from
starttogoalusing a previously computed plan.This is a generic method that works for any planner (\(\mathbb{R}^2\) or \(\SE{2}\)) that can incrementally determine the next point on the path. The method performs the following steps:
Validate start and goal
If
animate, visualize the environment usingplot()Iterate on the class’s
next()method until thegoalis achieved, and ifanimateplot points.
- Seealso
next()plan()
- plot(path=None, line=None, line_r=None, configspace=False, unwrap=True, direction=None, background=True, path_marker=None, path_marker_reverse=None, start_marker=None, goal_marker=None, start_vehicle=None, goal_vehicle=None, start=None, goal=None, ax=None, block=False, bgargs={}, **unused)[source]
Plot vehicle path (superclass)
- Parameters
path ((N, 2) or ndarray(N, 3)) – path, defaults to None
direction (array_like(N), optional) – travel direction associated with each point on path, is either >0 or <0, defaults to None
line (sequence of dict of arguments for
plot) – line style for forward motion, default is striped yellow on blackline_r (sequence of dict of arguments for
plot) – line style for reverse motion, default is striped red on blackconfigspace (bool, optional) – plot the path in 3D configuration space, input must be 3xN. Start and goal style will be given by
qstart_markerandqgoal_marker, defaults to Falseunwrap (bool, optional) – for configuration space plot unwrap \(\theta\) so there are no discontinuities at \(\pm \pi\), defaults to True
background (bool, optional) – plot occupancy grid if present, default True
start_marker (dict, optional) – style for marking start point
goal_marker (dict, optional) – style for marking goal point
start_vehicle (dict) – style for vehicle animation object at start configuration
goal_vehicle (dict) – style for vehicle animation object at goal configuration
start (array_like(2) or array_like(3), optional) – start position \((x, y)\) or configuration \((x, y, \theta)\), defaults to value previously set
goal (array_like(2) or array_like(3), optional) – goal position \((x, y)\) or configuration \((x, y, \theta)\), defaults to value previously set
bgargs (dict, optional) – arguments passed to
plot_bg(), defaults to Noneax (matplotlib axes) – axes to plot into
block (bool, optional) – block after displaying the plot
Plots the start and goal location/pose if they are specified by
startorgoalor were set by the object constructor orplanorquerymethod.If the
startandgoalhave length 2, planning in \(\mathbb{R}^2\), then markers are drawn using styles specified bystart_markerandend_markerwhich are dicts using Matplotlib keywords, for example:planner.plot(path, start=dict(marker='s', color='b'))
If the
startandgoalhave length 3, planning in \(\SE{2}\), andconfigspaceis False, then direction-indicating markers are used to display start and goal configuration. These are also given as dicts but have two items:'shape'which is the shape of the polygonal marker and is either'triangle'or'car'. The second item'args'is passed tobase.plot_poly()and Matplotlib and could have values such asfilled=Trueorcolor.If
configspaceis False then a 3D plot is created and the start and goal are indicated by Matplotlib markers specified by the dictsstart_markerandend_markerDefault values are provided for all markers:
the start point is a circle
the goal point is a star
the start vehicle style is a
VehiclePolygon(shape='car')as an unfilled outlinethe goal vehicle style is a
VehiclePolygon(shape='car')as a transparent filled shape
If
backgroundis True then the background of the plot is either or both of:the occupancy grid
the distance field of the planner
Additional arguments
bgargscan be passed through toplot_bg()If
pathis specified it has one column per point and either 2 or 3 rows:2 rows describes motion in the \(xy\)-plane and a 2D plot is created
3 rows describes motion in the \(xy\theta\)-configuration space. By default only the \(xy\)-plane is plotted unless
configspaceis True in which case motion in \(xy\theta\)-configuration space is shown as a 3D plot.
If the planner supports bi-directional motion then the
directionoption gives the direction for each point on the path.Forward motion segments are drawn using style information from
linewhile reverse motion segments are drawn using style information fromline_r. These are each a sequence of dicts of Matplotlib plot options which can draw an arbitrary number of lines on top of each other. The default:line = ( {color:'black', linewidth:4}, {color:'yellow', linewidth:3, dashes:(5,5)} )
will draw a blackline of width 4 with a dashed yellow line of width 3 plotted on top, giving a line of alternating black and yellow dashes.
- Seealso
plot_bg()base.plot_poly()
- plot_bg(distance=None, cmap='gray', ax=None, inflated=True, colorbar=True, **unused)[source]
Plot background (superclass)
- Parameters
distance (ndarray(N,M), optional) – override distance field, defaults to None
cmap (str or Colormap, optional) – Specify a colormap for the distance field, defaults to ‘gray’
Displays the background which is either the occupancy grid or a distance field. The distance field encodes the distance of a point from the goal, small distance is dark, a large distance is bright.
- If the planner has an occupancy grid then that will be displayed with:
free cells in white
occupied cells in red
inflated occupied cells in pink
If distance is provided, or the planner has a distancemap attribute the the distance field will be used as the background and obstacle cells (actual or inflated) will be shown in red. A colorbar is added.
Occupancy grid base classes
- class roboticstoolbox.mobile.OccGrid.BaseMap(workspace=None, name=None, **unused)[source]
Bases:
ABC
- class roboticstoolbox.mobile.OccGrid.BaseOccupancyGrid(grid=None, origin=(0, 0), value=0, cellsize=1, **kwargs)[source]
Bases:
BaseMap- copy()[source]
Copy an occupancy grid (superclass)
- Returns
copy of the ocupancy grid
- Return type
OccGrid
- property grid
Occupancy grid as a NumPy array (superclass)
- Returns
binary occupancy grid
- Return type
ndarray(N,M) of bool
If
inflate()has been called, this will return the inflated occupancy grid.
- property xmin
Minimum x-coordinate of this grid (superclass)
- Returns
minimum world x-coordinate
- Return type
float
- property xmax
Maximum x-coordinate of this grid (superclass)
- Returns
maximum world x-coordinate
- Return type
float
- property ymin
Minimum y-coordinate of this grid (superclass)
- Returns
minimum world y-coordinate
- Return type
float
- property ymax
Maximum y-coordinate of this grid (superclass)
- Returns
maximum world y-coordinate
- Return type
float
- property shape
Shape of the occupancy grid array (superclass)
- Returns
shape of the occupancy grid array
- Return type
2-tuple
This is the shape of the NumPy array that holds the occupancy grid.
- property maxdim
Maximum dimension of grid in world coordinates (superclass)
- Returns
maximum side length of the occupancy grid
- Return type
float
- property workspace
Bounds of the occupancy grid in world coordinates (superclass)
- Returns
workspace bounds [xmin, xmax, ymin, ymax]
- Return type
ndarray(4)
Returns the bounds of the occupancy grid in world coordinates.
- property name
Occupancy grid name (superclass)
- Returns
name of the occupancy grid
- Return type
str
- set(region, value)[source]
Set region of map (superclass)
- Parameters
region (array_like(4)) – The region [xmin, ymin, xmax, ymax]
value (int, bool, float) – value to set cells to
- g2w(p)[source]
Convert grid coordinate to world coordinate (superclass)
- Parameters
p (array_like(2)) – grid coordinate (column, row)
- Returns
world coordinate (x, y)
- Return type
ndarray(2)
The grid cell size and offset are used to convert occupancy grid coordinate
pto a world coordinate.
- w2g(p)[source]
Convert world coordinate to grid coordinate (superclass)
- Parameters
p (array_like(2)) – world coordinate (x, y)
- Returns
grid coordinate (column, row)
- Return type
ndarray(2)
The grid cell size and offset are used to convert
pto an occupancy grid coordinate. The grid coordinate is rounded and cast to integer value. No check is made on the validity of the coordinate.
- plot(map=None, ax=None, block=False, **kwargs)[source]
Plot the occupancy grid (superclass)
- Parameters
map (ndarray(N,M), optional) – array which is plotted instead of the grid, must be same size as the occupancy grid,defaults to None
ax (Axes2D, optional) – matplotlib axes to plot into, defaults to None
block (bool, optional) – block until plot is dismissed, defaults to False
kwargs – arguments passed to
imshow
The grid is plotted as an image but with axes in world coordinates.
The grid is a NumPy boolean array which has values 0 (false=unoccupied) and 1 (true=occupied). Passing a cmap option to imshow can be used to control the displayed color of free space and obstacles.
- line_w(p1, p2)[source]
Get index of cells along a line segment (superclass)
- Parameters
p1 (array_like(2)) – start
p2 (array_like(2)) – end
- Returns
index into grid
- Return type
ndarray(N)
Get the indices of cells along a line segment defined by the end points given in world coordinates.
The returned indices can be applied to a raveled view of the grid.
- property ravel
Ravel the grid (superclass)
- Returns
1D view of the occupancy grid
- Return type
ndarray(N)