
Graphics operations#
Draw graphical primitives into an image stored in an array. The functions
draw_xxx perform a similar operation to the functions plot_xxx
from the Spatial Math Toolbox.
However the draw_xxx render the graphical primitive into the image pixel
array, whereas the plot_xxx use Matplotlib to render the graphical primitive
in a figure window.
Drawing primitives (boxes, circles, text) and color lookup onto OpenCV images.
- draw_box(image: ndarray, l: int | None = None, r: int | None = None, t: int | None = None, b: int | None = None, w: int | None = None, h: int | None = None, lb: tuple[int, int] | list[int] | ndarray | None = None, lt: tuple[int, int] | list[int] | ndarray | None = None, rb: tuple[int, int] | list[int] | ndarray | None = None, rt: tuple[int, int] | list[int] | ndarray | None = None, wh: int | tuple[int, int] | list[int] | ndarray | None = None, centre: tuple[int, int] | list[int] | ndarray | None = None, center: tuple[int, int] | list[int] | ndarray | None = None, lbrt: tuple[int, int, int, int] | list[int] | ndarray | None = None, lrbt: tuple[int, int, int, int] | list[int] | ndarray | None = None, ltrb: tuple[int, int, int, int] | list[int] | ndarray | None = None, lbwh: tuple[int, int, int, int] | list[int] | ndarray | None = None, ax: Any = None, color: Any = None, thickness: int = 1, antialias: bool = False) tuple[tuple[int, int], tuple[int, int]][source][source]#
Draw a box in an image
- Parameters:
image (ndarray(H,W), ndarray(H,W,P)) – image to draw into, greyscale or color
l (int, optional) – left side coordinate
r (int, optional) – right side coordinate
t (int, optional) – top side coordinate
b (int, optional) – bottom side coordinate
w (int, optional) – box width
h (int, optional) – box height
lb (array_like(2), optional) – left-bottom corner [u,v]
lt (array_like(2), optional) – left-top corner [u,v]
rb (array_like(2), optional) – right-bottom corner (u,v)
rt (array_like(2), optional) – right-top corner (u,v)
wh (array_like(2), optional) – width and height
centre (array_like(2), optional) – box centre (u,v)
lbrt (array_like(4), optional) – left-bottom-right-top [xmin, ymin, xmax, ymax]
lrbt (array_like(4), optional) – left-right-bottom-top [xmin, ymin, xmax, ymax]
ltrb (array_like(4), optional) – bounding box [xmin, ymin, xmax, ymax]
lbwh (array_like(4), optional) – left-bottom-width-height [xmin, ymin, width, height]
color (scalar or array_like) – color of line
thickness (int, optional) – line thickness, -1 to fill, defaults to 1
antialias (bool, optional) – use antialiasing, defaults to False
ax – axes to draw into
- Type:
Matplotlib axes
- Returns:
bottom-left and top-right corners of the box
- Return type:
(2-tuple, 2-tuple)
Draws a box into the specified image using OpenCV. The input
imageis modified.The box can be specified in many ways, any combination of inputs is allowed so long as the box is fully specified:
bounding box [xmin, xmax; ymin, ymax]
left-top-right-bottom [xmin, ymin, xmax, ymax]
left side
right side
top side
bottom side
centre and width+height
left-bottom and right-top corners
left-bottom corner and width+height
right-top corner and width+height
left-top corner and width+height
where left-bottom is (xmin, ymin), left-top is (xmax, ymax)
Example:
(
Source code,png,hires.png,pdf)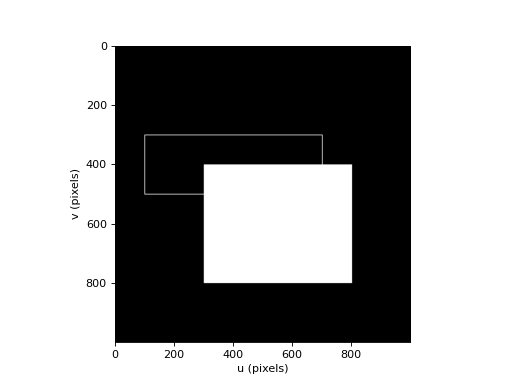
Warning
For images y increases downwards so top of the box, has a larger v-coordinate, and is lower in the image.
Note
If
imagehas multiple planes thencolorshould have the same number of elements as the image has planes. If it is a scalar that value is used for each color plane. For a color imagecolorcan be a string color name.- Seealso:
plot_boxopencv.rectangle
- draw_circle(image: ndarray, centre: tuple[float, float] | list[float] | ndarray, radius: int, color: Any, thickness: int = 1, antialias: bool = False, center: tuple[float, float] | list[float] | ndarray | None = None) ndarray[source][source]#
Draw line in image
- Parameters:
image (ndarray(H,W), ndarray(H,W,P)) – image to draw into, greyscale or color
centre – centre coordinate
radius – radius in pixels
color (scalar, array_like(3)) – color of circle
thickness (int, optional) – width of line in pixels, -1 to fill, defaults to 1
antialias (bool, optional) – use antialiasing, defaults to False
- Raises:
TypeError – can’t draw color into a greyscale image
- Returns:
passed image as modified
- Return type:
ndarray(H,W), ndarray(H,W,P)
The centre coordinate can be a tuple, list or NumPy array. The values are rounded to the nearest integer. The radius is also rounded to the nearest integer.
Example:
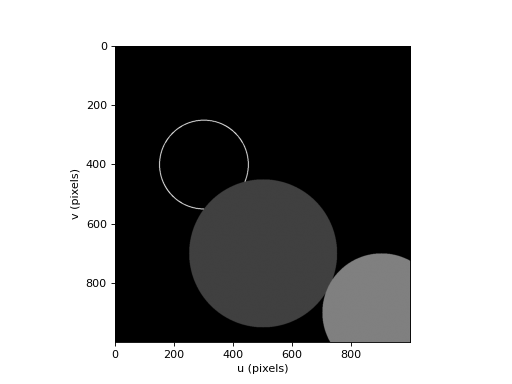
from machinevisiontoolbox import draw_circle, idisp
import numpy as np
img = np.zeros((1000, 1000), dtype='uint8')
draw_circle(img, (300,400), 150, thickness=2, color=200)
draw_circle(img, (500,700), 250, thickness=-1, color=50)  # filled
draw_circle(img, (900,900), 200, thickness=-1, color=100)  # filled
idisp(img)
(
Source code,png,hires.png,pdf)
Note
If
imagehas multiple planes thencolorshould have the same number of elements as the image has planes. If it is a scalar that value is used for each color plane. For a color imagecolorcan be a string color name.- Seealso:
plot_circleopencv.circle
- draw_labelbox(image: ndarray, text: str, textcolor: Any = None, labelcolor: Any = None, font: str = 'simplex', fontsize: float = 0.9, fontheight: int | None = None, fontthickness: int = 2, position: str = 'topleft', **boxargs: Any) ndarray[source][source]#
Draw a labelled box in an image
- Parameters:
image (ndarray(H,W), ndarray(H,W,P)) – image to draw into
text (str) – text label
textcolor (str, array_like(3), optional) – text color, defaults to black
labelcolor (str, array_like(3), optional) – label background color
position – place to draw the label: ‘topleft’ (default), ‘topright, ‘bottomleft’ or ‘bottomright’
font (str, optional) – OpenCV font, defaults to cv2.FONT_HERSHEY_SIMPLEX
fontsize (float, optional) – OpenCV font scale, defaults to 0.3
fontheight (int, optional) – OpenCV font height in pixels, overrides
fontsizeif givenfontthickness (int, optional) – font thickness in pixels, defaults to 2
boxargs – arguments passed to
draw_box
- Raises:
TypeError – can’t draw color into a greyscale image
- Returns:
passed image as modified
- Return type:
ndarray(H,W), ndarray(H,W,P)
The position of the box is specified using the same arguments as for
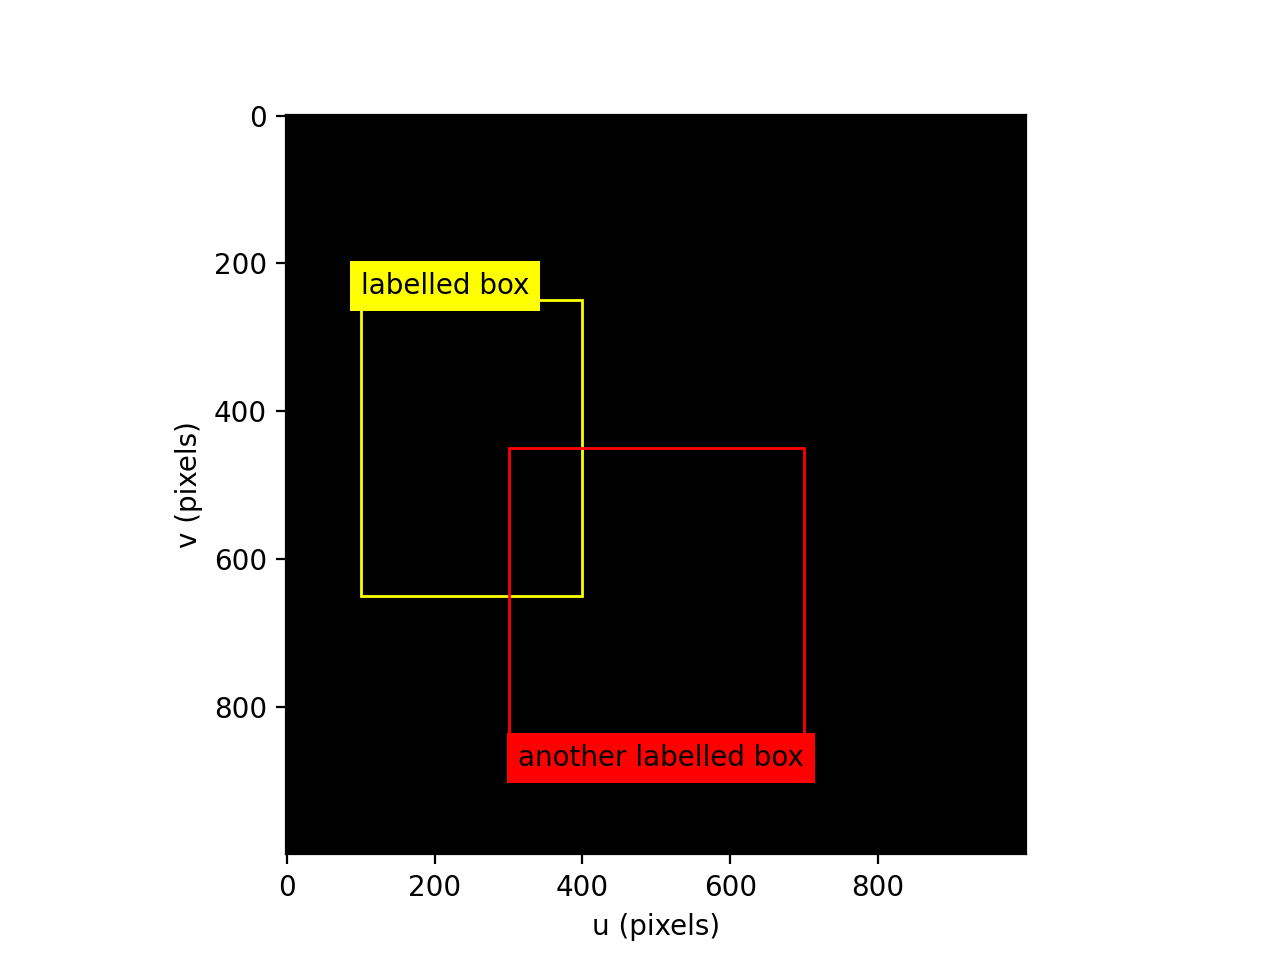
draw_box. The label font is specified using the same arguments as fordraw_text. Iflabelcoloris specified it is used as the background color for the text label, otherwise the box color is used.Example:
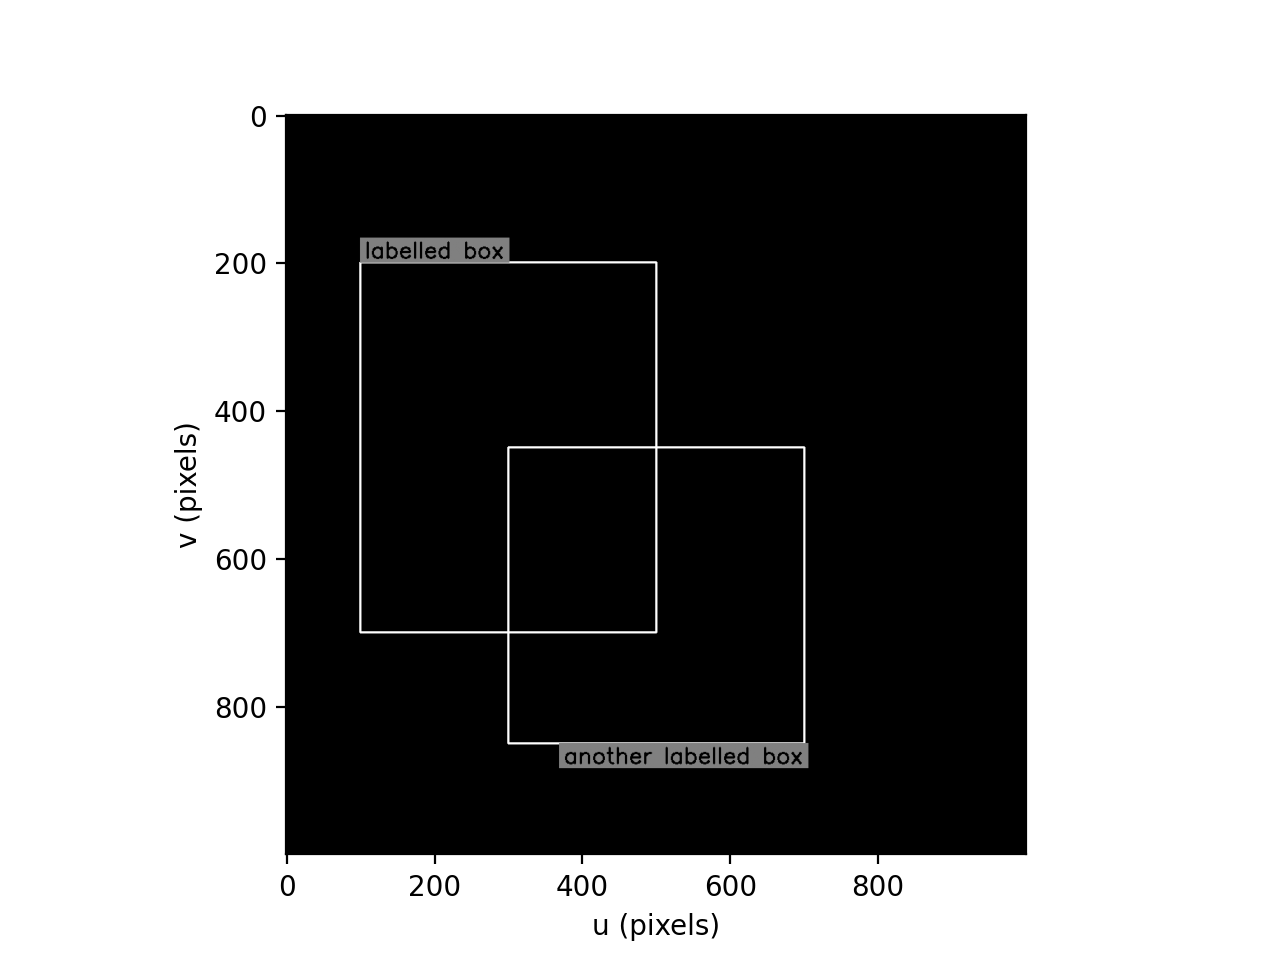
from machinevisiontoolbox import draw_labelbox, idisp
import numpy as np
img = np.zeros((500, 500))
draw_labelbox(img, "labelled box", lbwh=[100, 200, 400, 500], textcolor=0, labelcolor=100, color=200, thickness=2, fontsize=1)
draw_labelbox(img, "another labelled box", position="bottomright", lbwh=[300, 450, 500, 400], textcolor=0, labelcolor=100, color=200, thickness=2, fontsize=1)
idisp(img)
(
Source code,png,hires.png,pdf)
Note
If
imagehas multiple planes thencolor,labelcolorandtextcolorshould have the same number of elements as the image has planes. If they are a scalar that value is used for each color plane. For a color imagecolorcan be a string color name.
- draw_line(image: ndarray, start: tuple[float, float] | list[float] | ndarray, end: tuple[float, float] | list[float] | ndarray, color: Any, thickness: int = 1, antialias: bool = False) ndarray[source][source]#
Draw line in image
- Parameters:
image (ndarray(H,W), ndarray(H,W,P)) – image to draw into, greyscale or color
start (array_like(2) int) – start coordinate (u,v)
end (array_like(2) int) – end coordinate (u,v)
color (scalar, array_like(3)) – color of line
thickness (int, optional) – width of line in pixels, defaults to 1
antialias (bool, optional) – use antialiasing, defaults to False
- Raises:
TypeError – can’t draw color into a greyscale image
- Returns:
passed image as modified
- Return type:
ndarray(H,W), ndarray(H,W,P)
The coordinates can be tuples, lists or NumPy arrays. The values are rounded to the nearest integer.
Example:
(
Source code,png,hires.png,pdf)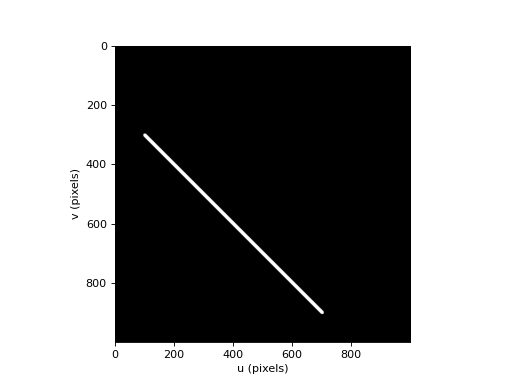
Note
If
imagehas multiple planes thencolorshould have the same number of elements as the image has planes. If it is a scalar that value is used for each color plane. For a color imagecolorcan be a string color name.- Seealso:
plot_lineopencv.line
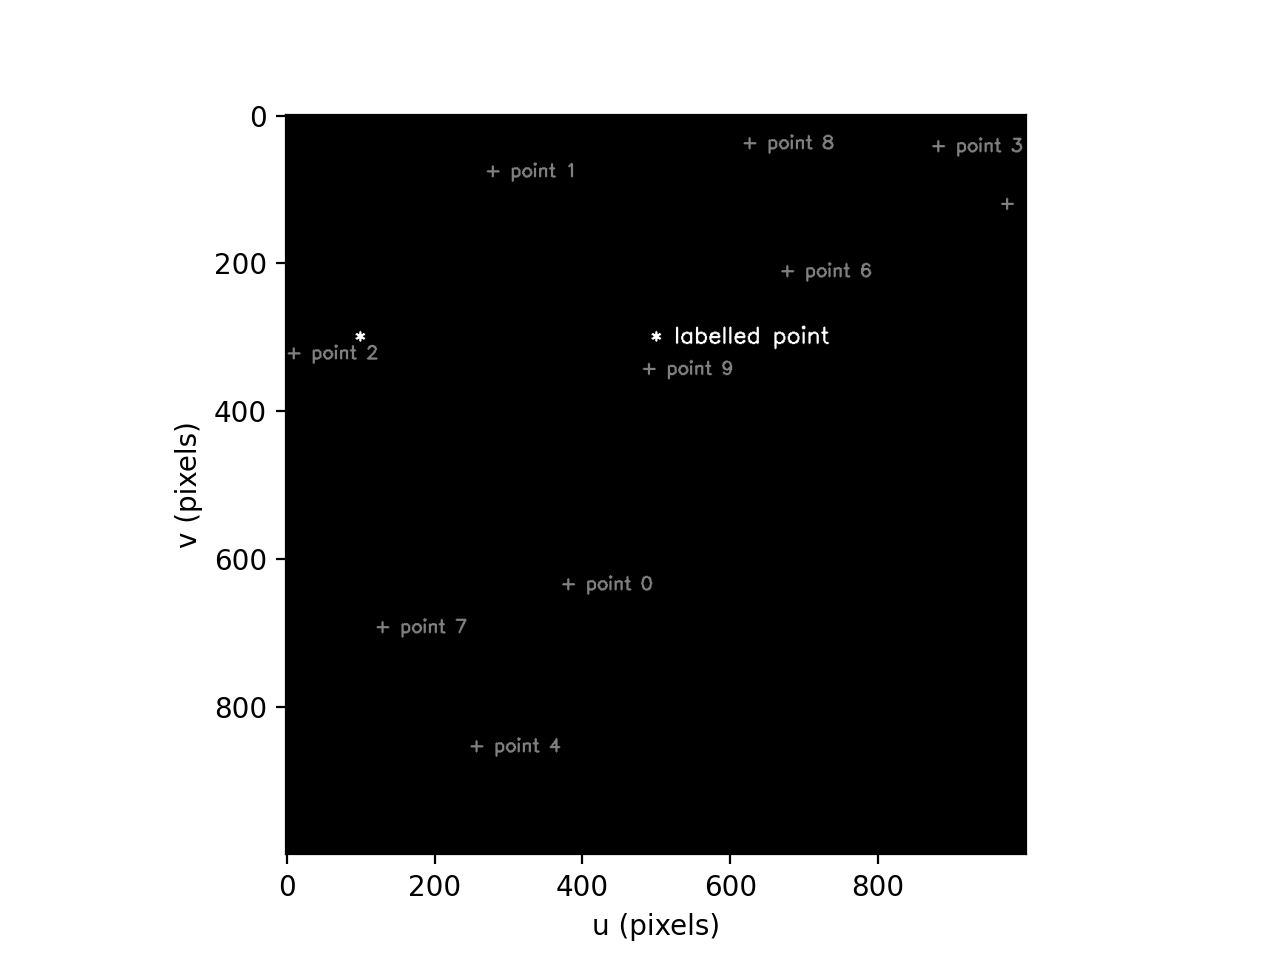
- draw_point(image: ndarray, pos: tuple[float, float] | list[float] | list[tuple[float, float]] | ndarray, marker: str = '+', text: Iterable[str] | str | None = None, color: Any = None, font: str = 'simplex', fontheight: int | None = None, fontsize: float = 0.3, fontthickness: int = 2) ndarray[source][source]#
Draw a marker in image
- Parameters:
image (ndarray(H,W), ndarray(H,W,P)) – image to draw into, greyscale or color
pos (array_like(2), ndarray(2,n), list of 2-tuples) – position of marker
marker (str, optional) – marker character, defaults to ‘+’
text (str, optional) – text label, defaults to None
color (str or array_like(3), optional) – text color, defaults to None
font (str, optional) – OpenCV font, defaults to cv2.FONT_HERSHEY_SIMPLEX
fontheight (int, optional) – height of font in pixels, defaults to None
fontsize (float, optional) – OpenCV font scale, defaults to 0.3
fontthickness (int, optional) – font thickness in pixels, defaults to 2
- Raises:
TypeError – can’t draw color into a greyscale image
- Returns:
passed image as modified
- Return type:
ndarray(H,W), ndarray(H,W,P)
The
textlabel is placed to the right of the marker, and vertically centred. The color of the marker can be different to the color of the text, the marker color is specified by a single letter in the marker string, eg. ‘b+’.Multiple points can be marked if
posis a \(2 \times n\) array or a list of coordinate pairs. In this case:if
textis a string it is processed withtext.format(i)whereiis the point index (starting at zero). “{0}” within text will be substituted by the point index.if
textis a list, its elements are used to label the points
The font is specified by a string which selects a Hershey vector (stroke) font.
Font name
OpenCV font name
"simplex"Hershey Roman simplex
"plain"Hershey Roman plain
"duplex"Hershey Roman duplex (double stroke)
"complex"Hershey Roman complex
"triplex"Hershey Romantriplex
"complex-small"Hershey Roman complex (small)
"script-simplex"Hershey script
"script-complex"Hershey script complex
"italic"Hershey italic
Note
Font size can be specified in two ways:
fontsizeis the OpenCV font size scale factor as used byopencv.putTextfontheightis the height of the font in pixels, this overridesfontsize. The font scale is computed fromfontheightusingopencv.getFontScaleFromHeight
Note
The centroid of the marker character is very accurately positioned at the specified coordinate. The text label is placed to the right of the marker.
Note
If
imagehas multiple planes thencolorshould have the same number of elements as the image has planes. If it is a scalar that value is used for each color plane. For a color imagecolorcan be a string color name.Example:
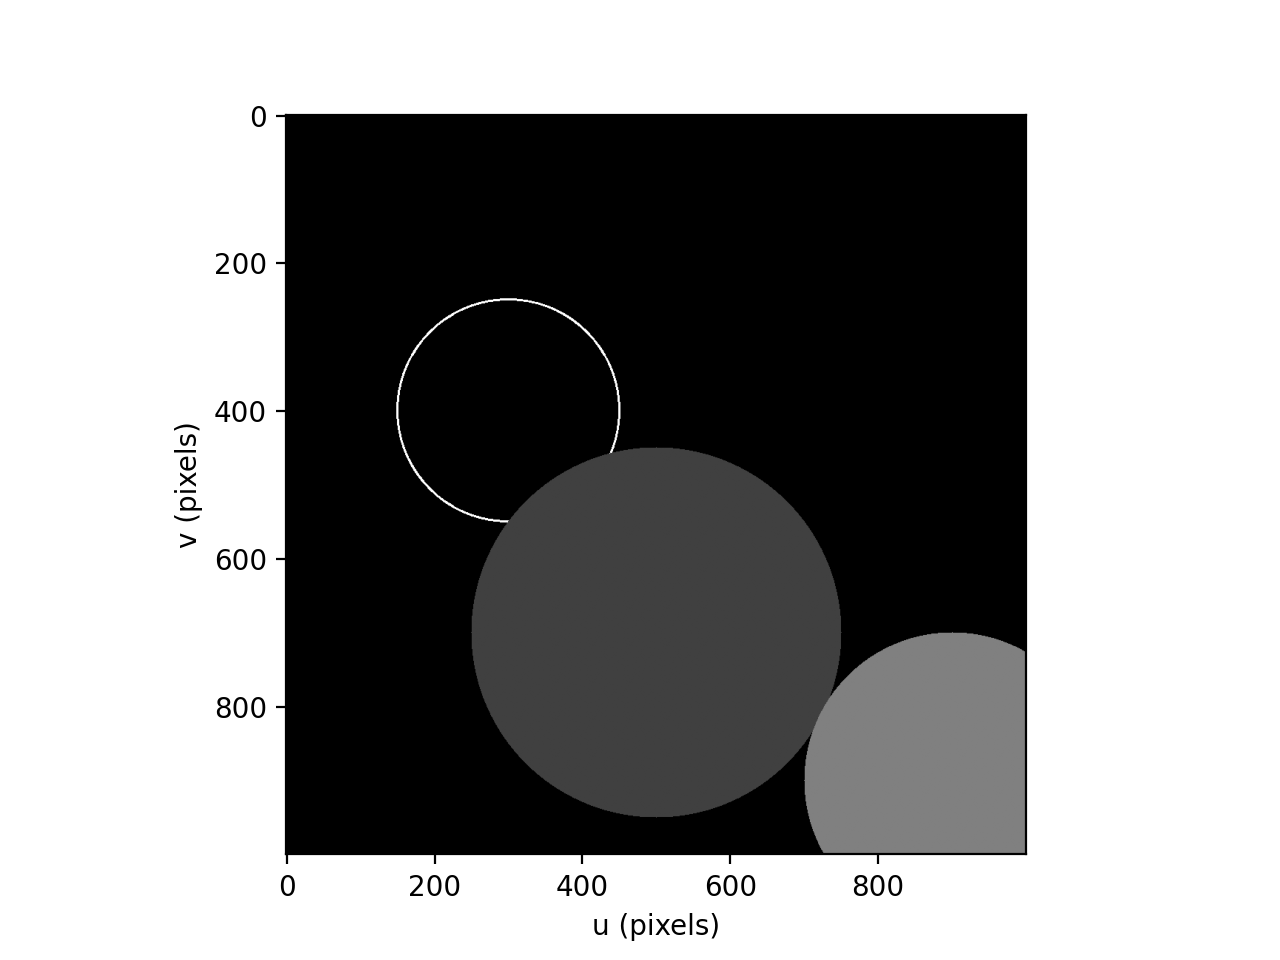
from machinevisiontoolbox import draw_point, idisp
import numpy as np
img = np.zeros((1000, 1000), dtype='uint8')
draw_point(img, (100, 300), '*', fontsize=1, color=200)
draw_point(img, (500, 300), '*', 'labelled point', fontsize=1, color=200)
draw_point(img, np.random.randint(1000, size=(2,10)), '+', 'point {0}', color=100, fontsize=0.8)
idisp(img)
(
Source code,png,hires.png,pdf)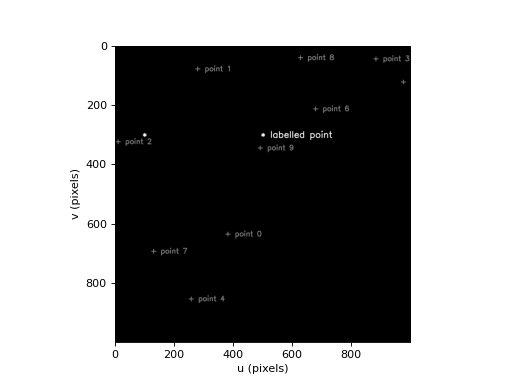
- Seealso:
plot_pointopencv.putText
- draw_text(image: ndarray, pos: tuple[int, int] | list[int] | ndarray, text: str | None = None, color: Any = None, font: str = 'simplex', fontheight: int | None = None, fontsize: float = 0.3, fontthickness: int = 2, antialias: bool = False) ndarray[source][source]#
Draw text in image
- Parameters:
image (ndarray(H,W), ndarray(H,W,P)) – image to draw into, greyscale or color
pos (array_like(2)) – position of text (u,v)
text (str) – text
color (scalar, array_like(3), str) – color of text
font (str, optional) – font name, defaults to “simplex”
fontheight (int, optional) – height of font in pixels, defaults to None
fontsize (float, optional) – OpenCV font scale, defaults to 0.3
fontthickness (int, optional) – font thickness in pixels, defaults to 2
antialias (bool, optional) – use antialiasing, defaults to False
- Returns:
passed image as modified
- Return type:
ndarray(H,W), ndarray(H,W,P)
The position corresponds to the bottom-left corner of the text box as seen in the image. The font is specified by a string which selects a Hershey vector (stroke) font.
Font name
OpenCV font name
'simplex'Hershey Roman simplex
'plain'Hershey Roman plain
'duplex'Hershey Roman duplex (double stroke)
'complex'Hershey Roman complex
'triplex'Hershey Romantriplex
'complex-small'Hershey Roman complex (small)
'script-simplex'Hershey script
'script-complex'Hershey script complex
'italic'Hershey italic
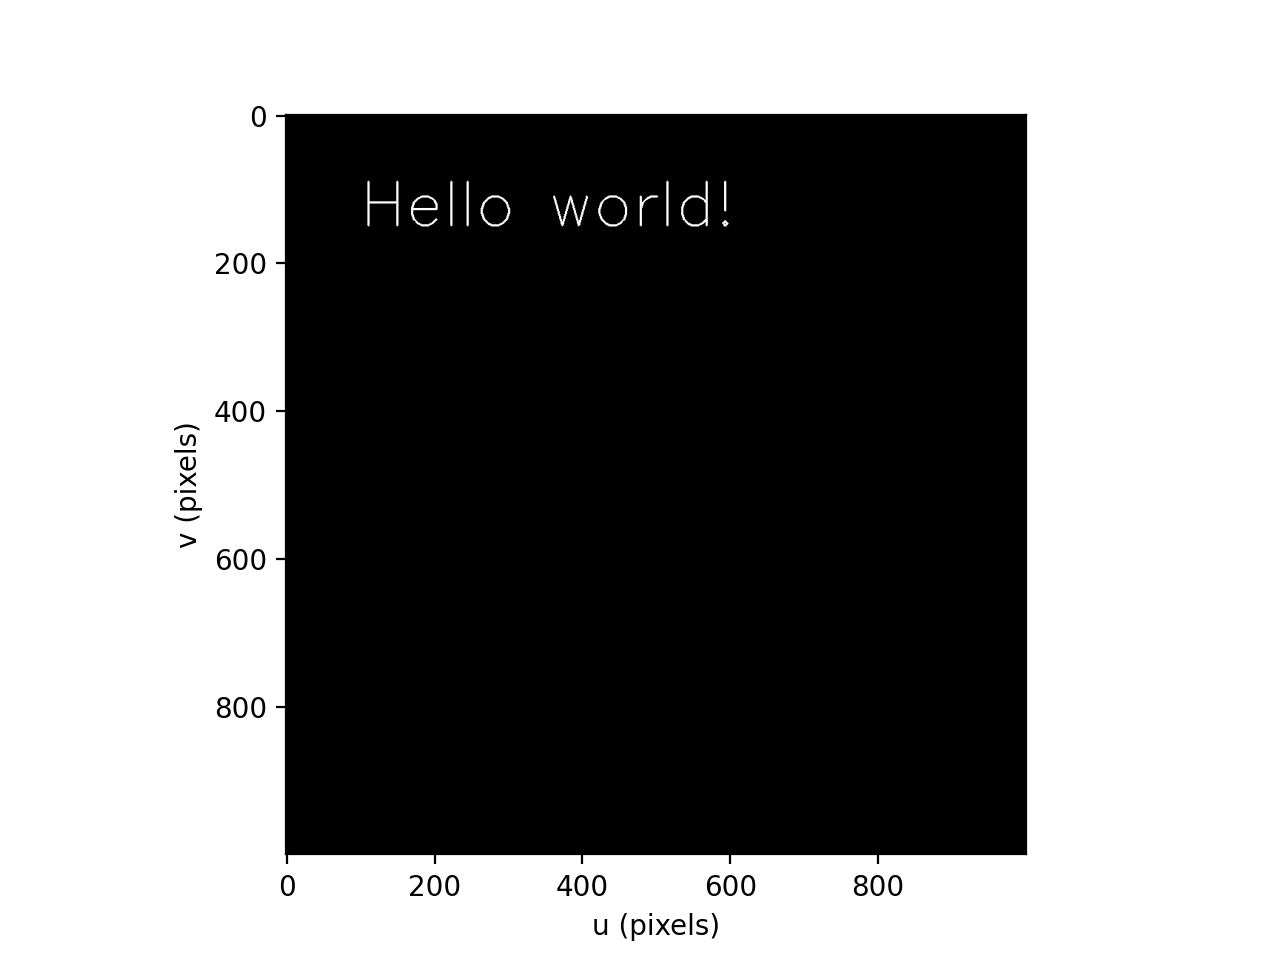
Example:
(
Source code,png,hires.png,pdf)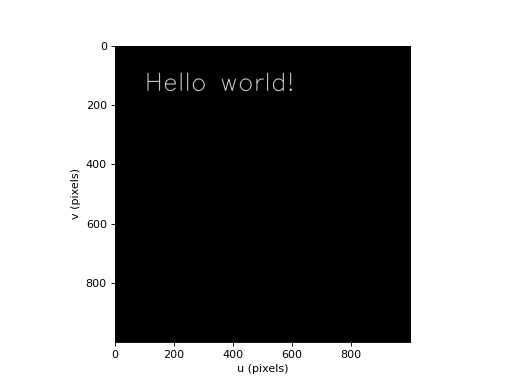
Note
Font size can be specified in two ways:
fontsizeis the OpenCV font size scale factor as used byopencv.putTextfontheightis the height of the font in pixels, this overridesfontsize. The font scale is computed fromfontheightusingopencv.getFontScaleFromHeight
Note
If
imagehas multiple planes thencolorshould have the same number of elements as the image has planes. If it is a scalar that value is used for each color plane. For a color imagecolorcan be a string color name.- Seealso:
plot_textopencv.putText
- mpl_styling(fmt: str | tuple[str] | None = None, defaults: dict = None, kwargs: dict = None)[source][source]#
Merge Matplotlib style options
- Parameters:
fmt (str or tuple[str], optional) – a format string, defaults to None
defaults (dict, optional) – a dictionary of default keyword arguments , defaults to None
kwargs (dict, optional) – a dictionary of keyword arguments , defaults to None
Matplotlib has two distinct ways of specifying styling for plots:
A format string, which is a compact way of specifying color, marker and linestyle, eg. ‘ro–’ for red circles with dashed lines.
Keyword arguments, which can specify a wide range of styling options, eg. color=’red’, marker=’o’, linestyle=’–‘.
The format string strictly specifies only color, marker and linestyle, and is a convenient way to specify these three options in a compact form. The keyword arguments are more verbose and flexible, and can specify any styling option, including color, marker and linestyle, but also many others such as linewidth, markersize, etc.
These two styles reflects the shift from “quick-and-dirty” plotting (as in original MATLAB) to modern, robust software engineering.
This function returns a dict of keyword arguments that merges the format string
fmt, the default keyword argumentsdefaultsand the user-specified keyword argumentskwargs. The precedence in decreasing order is:kwargs,fmt,defaults.As a convenience to users, many Toolbox functions accept a
fmtargument, which is passed to this function to merge with the keyword arguments. This allows users to specify styling in a compact format string, while still allowing for more detailed styling through keyword arguments with decent defaults.def function(*fmt, ..., **kwargs): options = mpl_styling(fmt, defaults={color='red', marker='o'}, kwargs=kwargs) . . plt.plot(x, y, **options)
- plot_labelbox(text: str, fmt: str | None = None, textcolor: Any = None, labelcolor: Any = None, position: str = 'topleft', **boxargs: Any) Rectangle[source][source]#
Plot a labelled box using Matplotlib
- Parameters:
text (str) – text label
fmt (str, optional) – format string for the simply specifying the box edge style, eg.
"y--"for a dashed yellow boxtextcolor (str, array_like(3), optional) – text color, defaults to None
labelcolor (str, array_like(3), optional) – label background color
position – place to draw the label: ‘topleft’ (default), ‘topright, ‘bottomleft’ or ‘bottomright’
boxargs – arguments passed to
plot_box
Plot a box with a label above it. The position of the box is specified using the same arguments as for
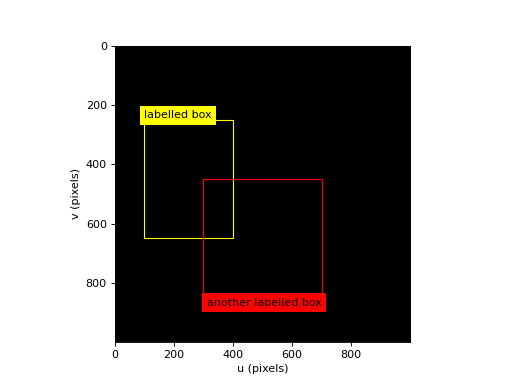
plot_box. The label font is specified using the same arguments as forplot_text. Iflabelcoloris specified it is used as the background color for the text label, otherwise the box color is used.Example:
from machinevisiontoolbox import plot_labelbox
import numpy as np
img = np.zeros((1000, 1000), dtype='uint8')
idisp(img) # create a Matplotlib window
plot_labelbox("labelled box", lbwh=[100, 250, 300, 400], color="yellow")
plot_labelbox('another labelled box', position="bottomright", lbwh=[300, 450, 500, 400], color="red")
(
Source code,png,hires.png,pdf)
- Seealso:
plot_box,plot_text