Image.dice#
- Image.dice(grid: int | tuple[int, int] | None = None, shape: int | tuple[int, int] | None = None, overlap: int | tuple[int, int] = 0) list[Self][source]#
Dice an image into a grid of subimages
- Parameters:
grid (int or 2-tuple, optional) – grid (nw, nh) of output tiles, defaults to None
shape (int or 2-tuple, optional) – size (w, h) of output tiles in pixels, defaults to None
overlap (int or 2-tuple, optional) – overlap between adjacent tiles in pixels, defaults to 0
- Returns:
a list of subimages in row-major order
- Return type:
list of
Image
The number and size of the subimages (tiles) can be specified in various ways:
grid=Ncreate a grid ofNxNsubimagesgrid=(N,M)create a grid ofNxMsubimagesshape=Ncreate a grid of subimages of sizeNxNpixelsshape=(N,M)create a grid of subimages of sizeNxMpixels
If
overlapis specified, the tiles will overlap. Ifshapeis specified the number of tiles in each direction can increase. Ifgridis specified number of tiles remains as specified. If:overlap=Noverlap byNpixels in both directionsoverlap=(N,M)overlap byNpixels in the horizontal direction andMpixels in the vertical direction
Note
If the image size is not an exact multiple of the grid size, the last rows and columns of the image will not be included in any of the tiles.
Example:
>>> from machinevisiontoolbox import Image
>>> mona = Image.Read("monalisa.png")
>>> subimages = mona.dice(grid=3)
>>> print(len(subimages))
9
>>> print(subimages[0])
Image: 225 x 233 (uint8), R:G:B
  R: span=[12, 254]; mean=141.176, 𝜎=47.0649; median=150
  G: span=[0, 224]; mean=114.96, 𝜎=39.0673; median=121
  B: span=[0, 112]; mean=42.7832, 𝜎=16.8952; median=42
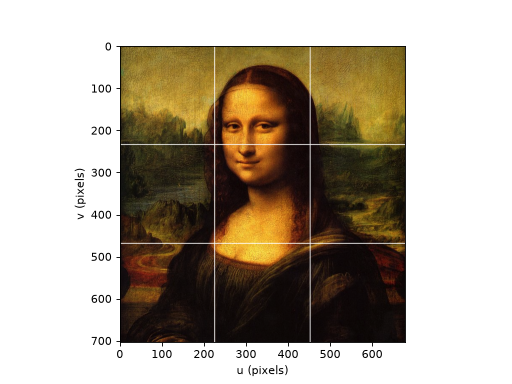
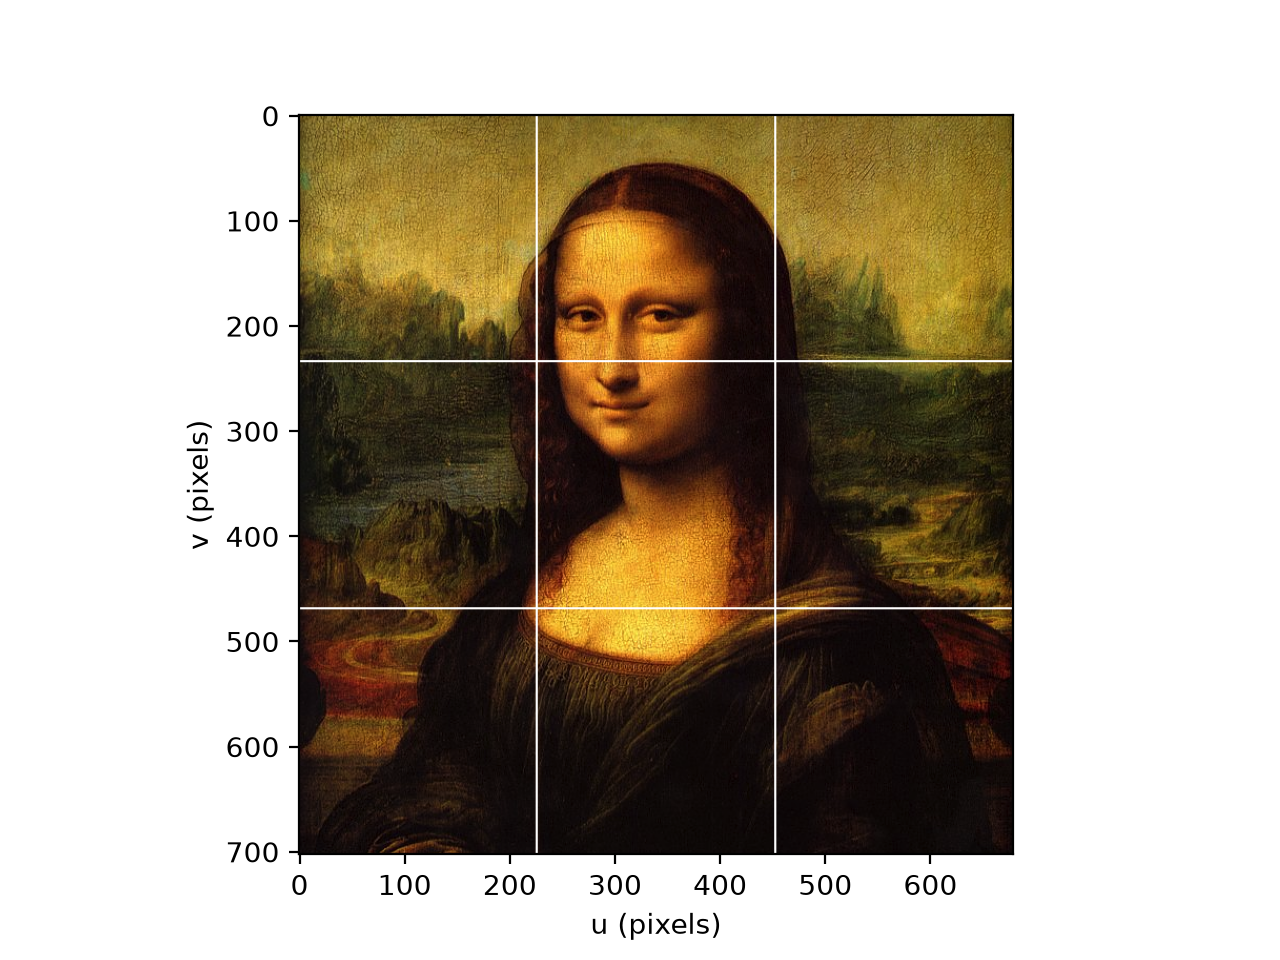
>>> Image.Tile(subimages, bgcolor=(255,255,255)).disp()
<matplotlib.image.AxesImage object at 0x7fe78638e4b0>
(
Source code,png,hires.png,pdf)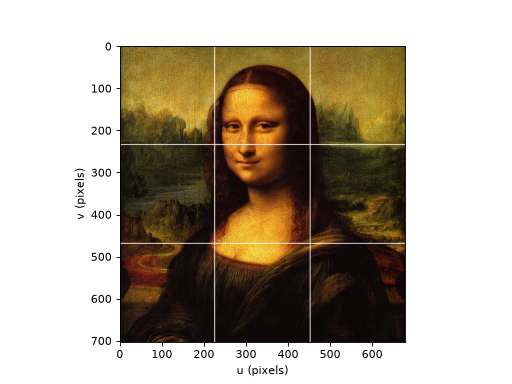
- Seealso: