Histogram.peaks#
- Histogram.peaks(**kwargs: Any) ndarray | list[ndarray][source][source]#
Histogram peaks
- Parameters:
kwargs – parameters passed to
findpeaks- Returns:
positions of histogram peaks
- Return type:
ndarray(M), list of ndarray
For a greyscale image return an array of grey values corresponding to local maxima. For a color image return a list of arrays of grey values corresponding to local maxima in each plane.
Example:
>>> from machinevisiontoolbox import Image
>>> hist = Image.Read('street.png').hist()
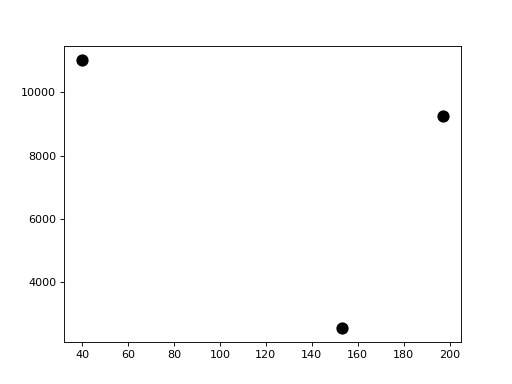
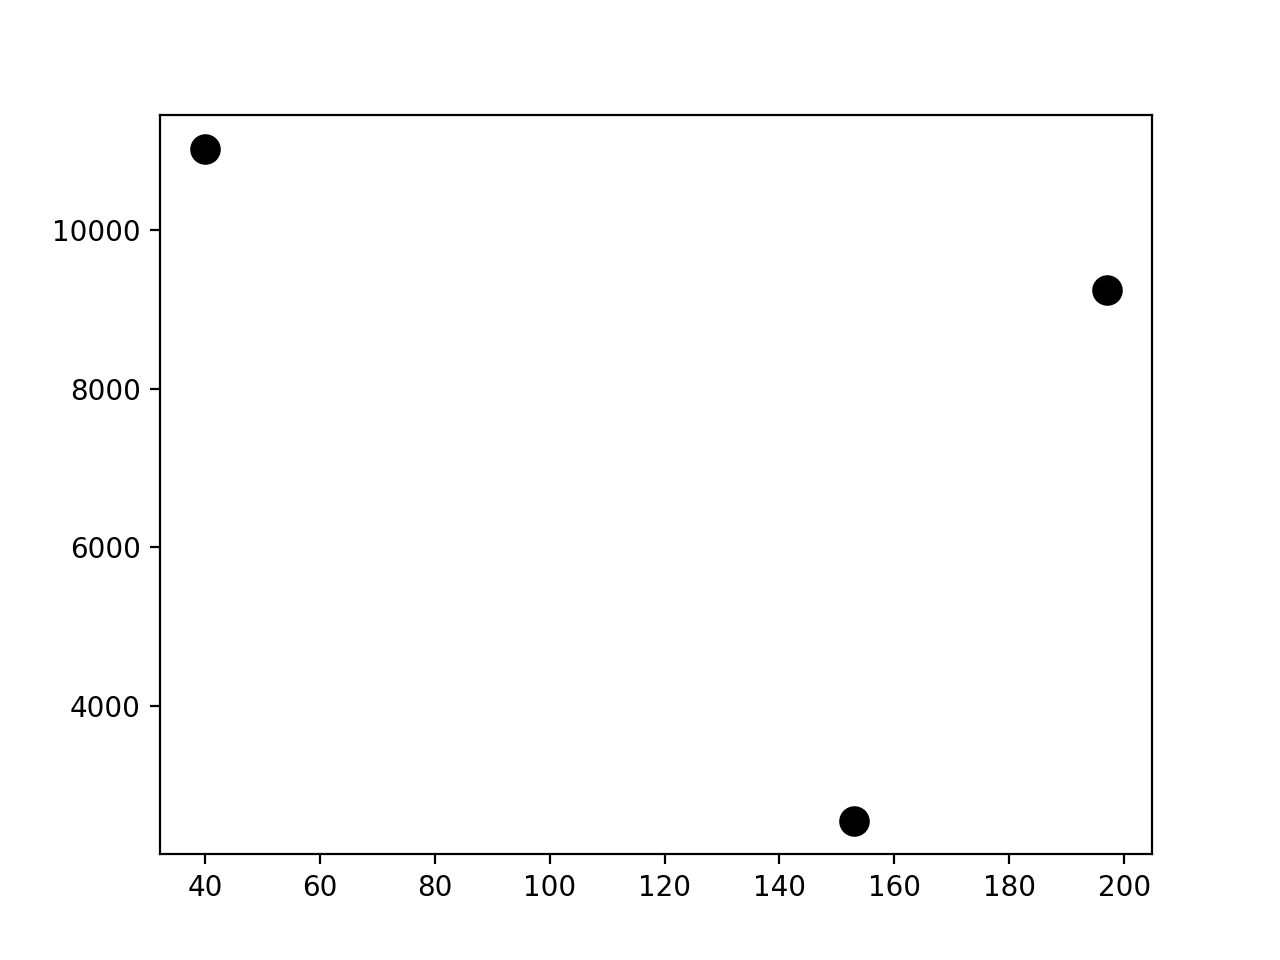
>>> hist.peaks(scale=20)
array([ 40., 197., 153.])
(
Source code,png,hires.png,pdf)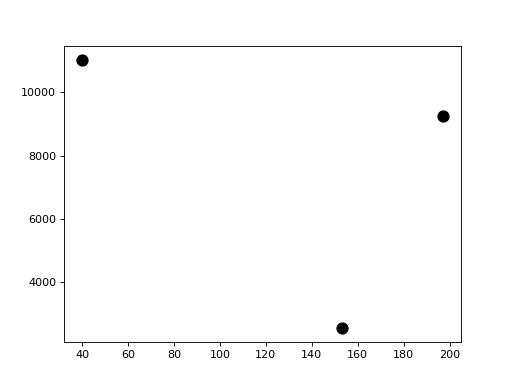
Note the first peak (at 8) is excluded because the maxima window ($x pm 20$) extends outside the histogram range.
- Seealso: