Blobs.plot_centroid#
- Blobs.plot_centroid(*args, label: bool = False, **kwargs: Any) None[source][source]#
Plot the centroid of blobs using Matplotlib
- Parameters:
label (bool) – add a sequential numeric label to each point, defaults to False
kwargs –
other arguments passed to
plot_pointPlot the major and minor axes of a blob or blobs on the current Matplotlib axes.
If no marker style is given then it will be an overlaid “o” and “x” in blue.
Example:
>>> from machinevisiontoolbox import Image
>>> im = Image.Read("sharks.png")
>>> blobs = im.blobs()
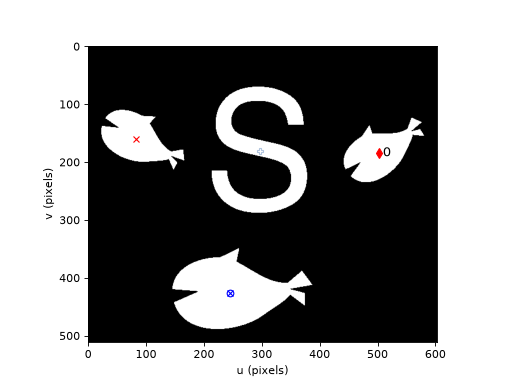
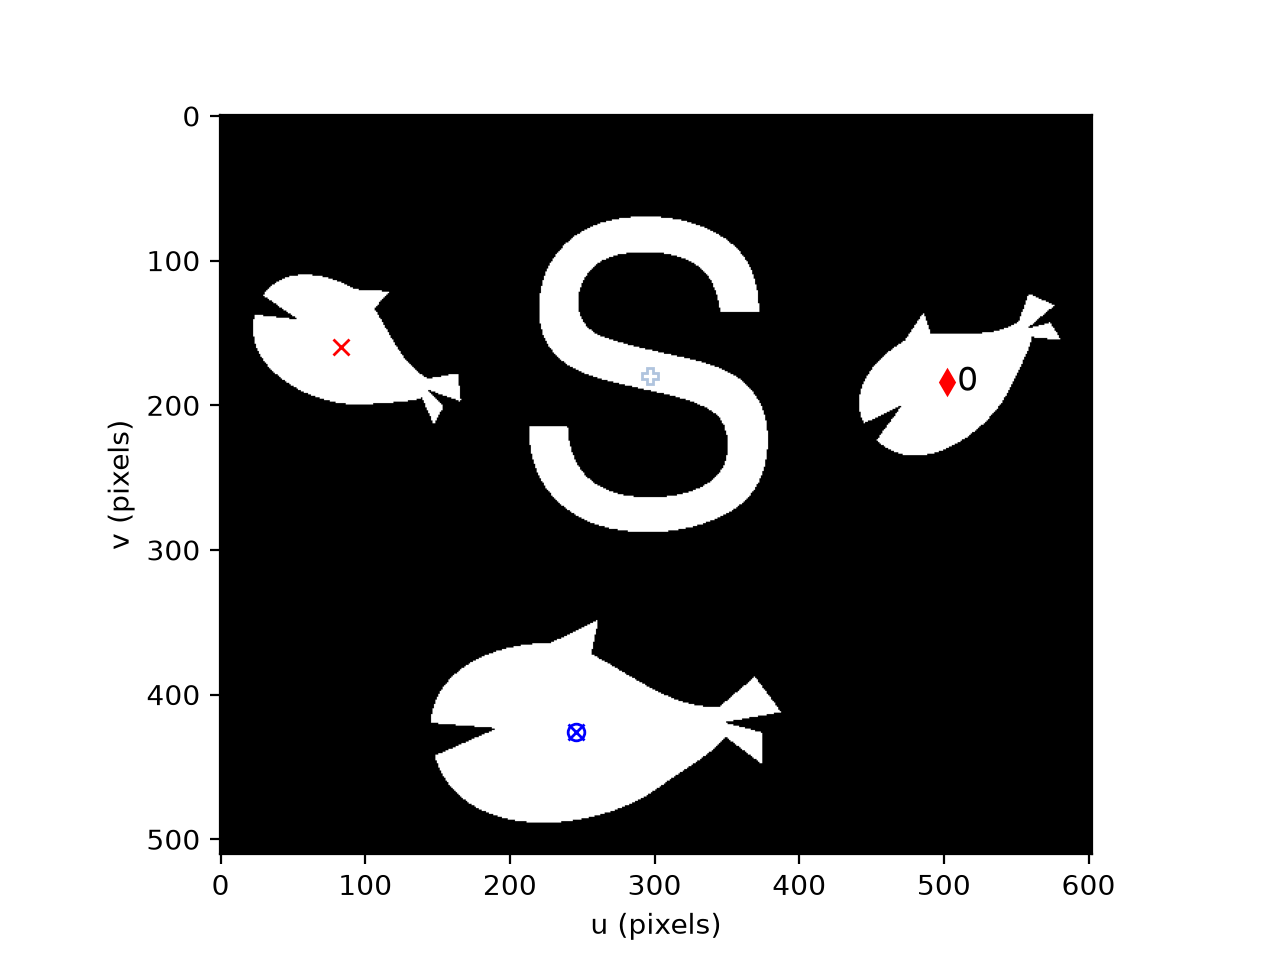
>>> blobs.plot_centroid(label=True)  # default blue "o" and "x" with blob id for all blobs
>>>
>>> blobs[0].plot_centroid()  # default blue "o" and "x"
>>> blobs[1].plot_centroid('rd', label=True) # red diamond with label
>>> blobs[2].plot_centroid(marker="x", color="red") # red "x"
>>> blobs[3].plot_centroid(marker="P", markeredgecolor="lightsteelblue", markerfacecolor="w", fillstyle="full")
(
Source code,png,hires.png,pdf)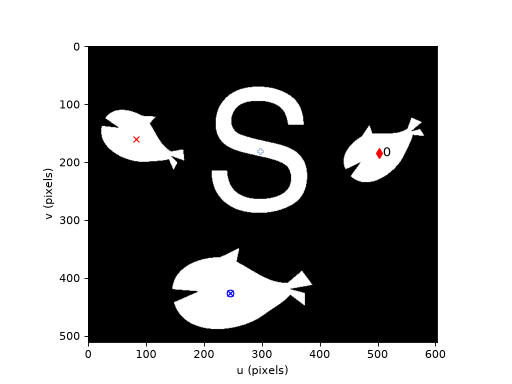
- Seealso:
plot_boxplot_perimeterplot_point