Blobs.plot_ellipse#
- Blobs.plot_ellipse(*args, **kwargs: Any) None[source][source]#
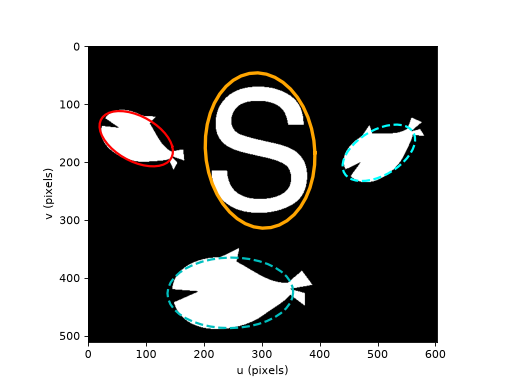
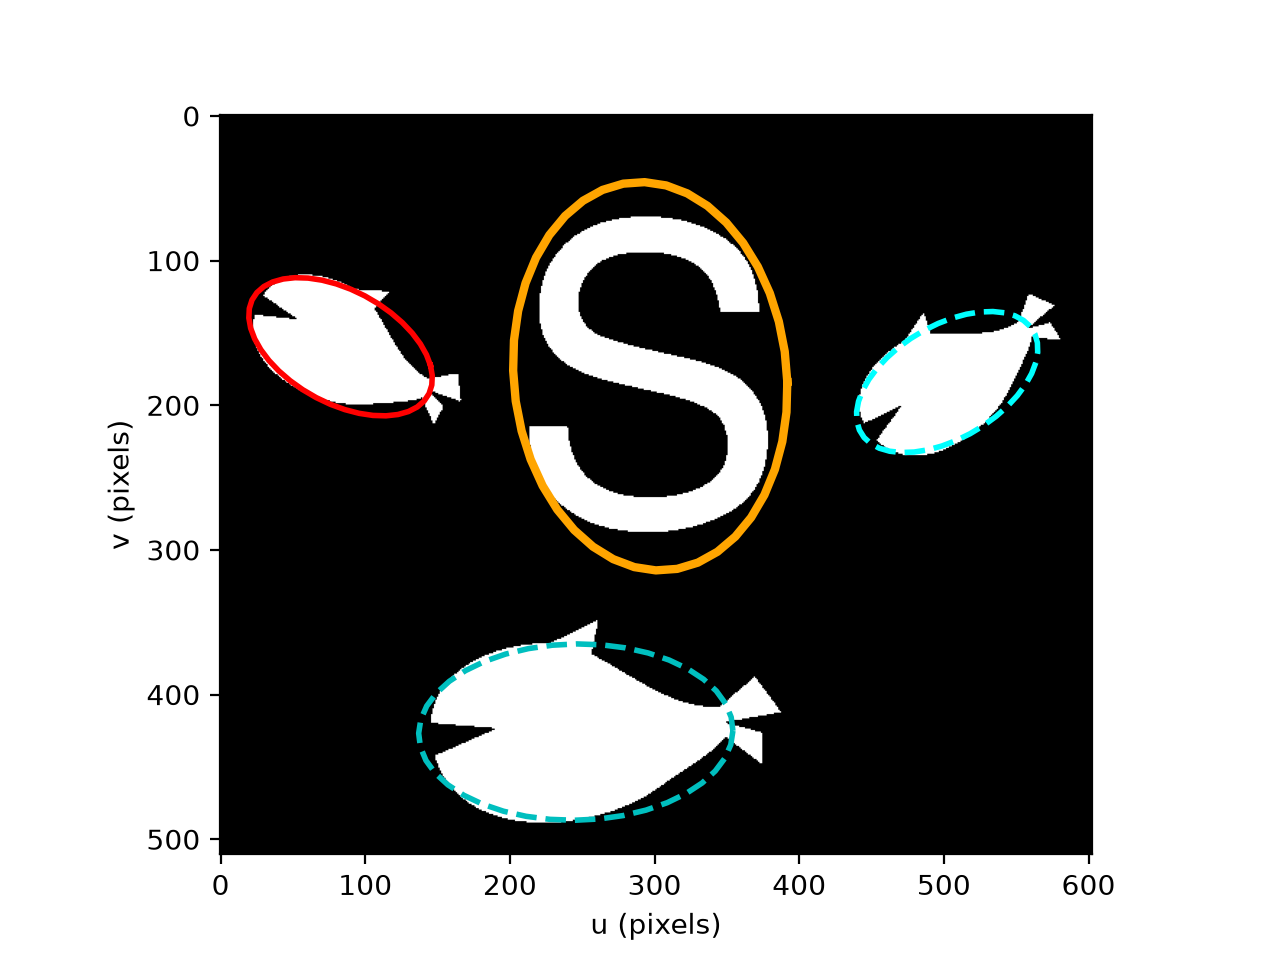
Plot the equivalent ellipses of blobs using Matplotlib
- Parameters:
kwargs – line style parameters passed to
plot
Plots the equivalent ellipses of blob or blobs on the current Matplotlib axes.
Example:
>>> from machinevisiontoolbox import Image
>>> im = Image.Read("sharks.png")
>>> blobs = im.blobs()
>>> blobs.plot_ellipse() # ellipses for all blobs, different colors
>>>
>>> blobs[0].plot_ellipse("c--") # cyan dashed line
>>> blobs[1].plot_ellipse(color="cyan", linestyle="--") # cyan dashed line
>>> blobs[2].plot_ellipse(color="red")
>>> blobs[3].plot_ellipse(color="orange", linewidth=3)
(
Source code,png,hires.png,pdf)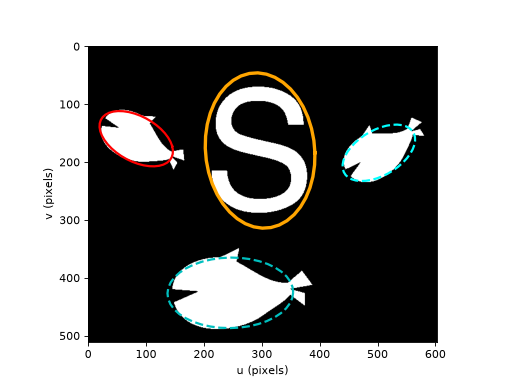
- Seealso:
plot_axesplot_boxplot_centroidplot_ellipse